
The narrative that “Data is the new Oil” has become surprisingly literal. Like the oil majors of the 20th century, Big Tech is transitioning from a world of capital-light economics to one defined by physical scale, infrastructure intensity, and resource constraints. This transition does not end their dominance, but it does mark the end of their financial exceptionalism. As AI industrializes the cloud, returns are increasingly driven by fixed assets, capital discipline, and utilization rather than pure innovation and growth. The buy-and-hold era of the mega cap technology stocks may be evolving into a more nuanced industrial allocation strategy, where long-term winners are likely to be those best positioned around scarce physical inputs—power, compute, and supply chains— and able to translate scale into durable cash flows.
For more than a decade, mega cap technology companies dominated global equity returns by combining scale, growth, and capital efficiency. Software-driven business models allowed revenues to compound without a commensurate rise in physical assets, sustaining unusually high returns on invested capital.
That era is changing. The rise of generative AI and hyperscale computing is forcing Big Tech into an industrial model defined by massive capital expenditures, physical infrastructure, energy constraints, and accelerated asset obsolescence. These companies are no longer primarily software platforms; they are becoming operators of some of the most capital-intensive systems in the global economy.
This transition is fundamentally altering these companies’ valuation, competitive moats, and long-term profitability. As balance sheets harden and capital intensity rises, investors must rethink how they measure returns, assess moats, and price risk across the mega cap technology complex.
AI Is a Physical Technology: The Industrialization of the Cloud
Most market commentary frames AI as an extension of the software model: intangible, infinitely scalable, and margin accretive. This is a fundamental misconception. At scale, AI is a physical technology requiring massive, recurring, and energy-intensive infrastructure. We are witnessing the commoditization of the algorithm and the monopolization of physical resources. The primary inputs for AI are tangible, scarce, and expensive. The supply chain now resembles that of the utilities or energy sectors: GPU clusters of unprecedented density, cooling systems requiring significant water rights, high-voltage interconnects, and secure land pipelines in grid-adjacent regions.
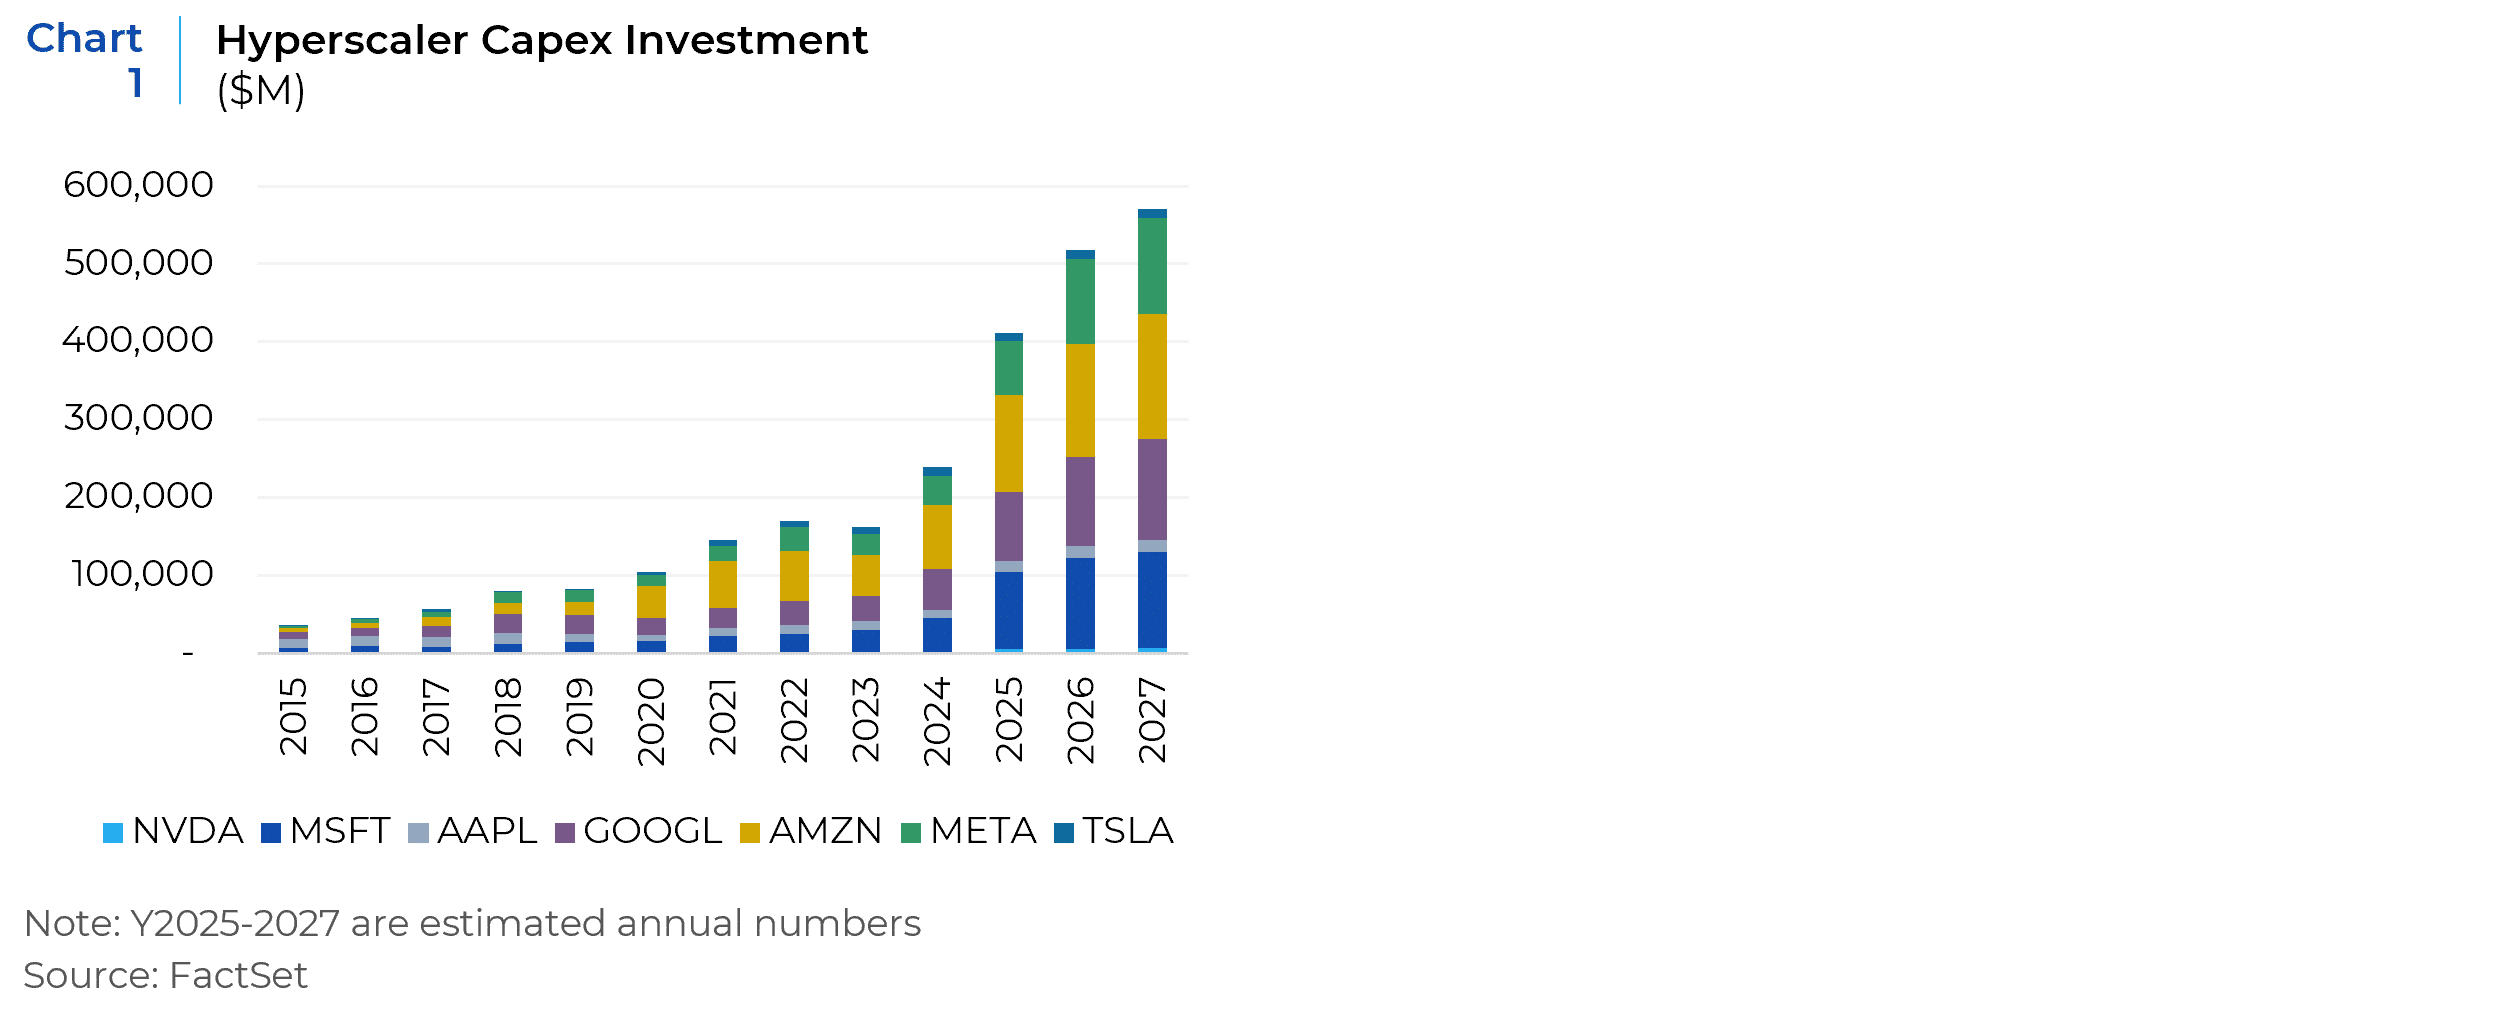
This shift is visible in the aggressive reinvestment rates across the mega cap cohort. Recent quarters have seen capital expenditure (Capex) rise to tens of billions (Chart 1), with explicit guidance citing AI computing needs:
- Alphabet has raised its Capex guidance significantly, explicitly citing AI compute needs, leading to sharp contractions in free cash flow during peak spending quarters.
- Microsoft is building new AI-optimized regions globally, investing billions in physical supercomputing clusters and energy procurement.
- Amazon (AWS) continues its largest infrastructure expansion in history—not in fulfillment centers, but in data center physical plants and chips.
- Meta has shifted its Capex composition almost entirely toward AI-specific infrastructure, prioritizing it over other business segments.
The binding constraint on this new growth model is no longer engineering talent, but physics. Perhaps the most underappreciated risk factor is resource scarcity (power and water). McKinsey estimates that AI-ready data centers will require $5.2 trillion in capital expenditures by 2030. More critically, the power grid is hitting a hard ceiling. In key hubs like Northern Virginia and Silicon Valley, utilities have paused new connections with wait-times extending to 2028. This places mega caps in an unfamiliar position: their growth is now capped by municipal permitting and grid capacity, forcing them to operate like industrial utilities rather than agile software startups.
The ROIC Crisis: Deteriorating Capital Turnover and the Dependence on Margins
For more than a decade, mega cap technology companies achieved a rare financial outcome: massive scale, rapid growth, and persistently high returns on invested capital. This was made possible by software economics, in which incremental revenue required little additional capital. One dollar of engineering expense could generate disproportionately large streams of high-margin revenue without expanding their asset base. The transition to generative AI fundamentally alters this equation. As hyperscalers deploy hundreds of billions of dollars into data centers, networking, and silicon, growth is no longer constrained by demand or talent, but by physical capital. This marks a structural shift from capital-light compounding to capital-constrained expansion. Rather than reflecting sustained capital efficiency, current ROIC levels are increasingly the result of margin preservation in the face of sharply deteriorating capital turnover.
ROIC can be decomposed as:
|
ROIC = Capital Turnover × NOPATMargin Where: Capital Turnover = Revenue / Invested Capital NOPAT Margin = Net Operating Profit After Tax / Revenue |
Historically, technology ROIC benefited from a rare combination of structurally high margins and exceptional capital turnover. Operating margins provided a strong baseline, while revenue scaled rapidly against a comparatively small, invested capital base. As a result, incremental ROIC expansion depended less on continuous margin improvement and more on the ability to grow revenue without proportionate asset growth.
That dynamic has now reversed. Beginning in 2024, for many hyperscalers, AI-driven infrastructure investment has caused invested capital to grow materially faster than revenue. Capital turnover has therefore compressed mechanically. For example, Microsoft’s capital turnover declined from approximately 0.7–0.8 during the cloud era to near 0.4, Alphabet’s from roughly 1.0 to ~0.56, and Amazon’s from ~1.5 to below 0.9. Despite this compression, ROIC remains relatively stable (Chart 2). The arithmetic implication is unavoidable: margins are now doing nearly all the work in sustaining return on invested capital (Chart 3).


In theory, declining capital turnover can be offset by rising margins. In practice, this offset becomes increasingly fragile as capital intensity rises. AI compute exhibits structural deflation as model architectures commoditize, and inference efficiency improves. Revenue growth therefore depends increasingly on volume and utilization rather than pricing power. At the same time, depreciation and infrastructure amortization are fixed and front-loaded, increasing the sensitivity of returns to demand stability.
This creates an asymmetric risk profile. Capital commitments are irreversible in the near term, while margins are exposed to competitive pressure and utilization volatility. ROIC therefore becomes less a function of innovation velocity and more a function of fixed-cost absorption — a defining characteristic of industrial economics.
In Charts 2 and 3, Nvidia is a prime illustration of this dynamic. During the early phase of acute capacity scarcity, both capital turnover and ROIC spiked. As invested capital scaled rapidly, turnover normalized and ROIC started to mean-revert. This pattern mirrors capital-cycle behavior observed in other asset-intensive industries.
The pressure on capital efficiency is amplified by a bifurcation within the AI asset base. Long-lived “shell” assets — land, buildings, power and cooling infrastructure — have economic lives measured in decades. In contrast, “core” compute assets — GPUs and accelerators — become economically obsolete within three to four years. This mismatch creates a structural reinvestment burden. A growing share of capital expenditure is required merely to maintain performance parity rather than expand productive capacity. As a result, reported depreciation increasingly understates economic wear and replacement needs, overstating the durability of returns.

The Valuation Implication: The Return to Price-to-Book (P/B)
For much of the past two decades, Price-to-Book ratios have carried little meaning in technology, as the primary value drivers — software, data, and network effects — were largely off-balance-sheet. This is changing. As mega cap balance sheets become increasingly dominated by tangible infrastructure, valuation frameworks that ignore the asset base become less informative. While book value does not establish a valuation floor in isolation, it increasingly reflects the replacement cost of scarce physical inputs such as power access, land, and compute capacity.
As a result, asset-based valuation metrics long associated with industrial and energy sectors regain relevance alongside traditional flow-based measures. The appropriate valuation question is no longer solely how fast revenues can grow, but how efficiently — and durably — large, fixed asset bases can be utilized over time.
Importantly, in addition to reported P/B, investors should also focus on adjusted asset-based measures (e.g. Price to Adjusted Book Value) that incorporate off-balance-sheet infrastructure commitments when assessing valuation and capital efficiency. Hyperscalers are financing a growing share of data center expansion through off-balance-sheet structures such as long-dated operating leases, joint ventures, and sale-leasebacks. These arrangements reduce reported assets but do not reduce economic capital employed or fixed-cost exposure.
The Profitability Paradox: Why Margins Look Strong while Cash Returns Weaken
The most pervasive bullish argument for the current Capex cycle is the substitution thesis: the idea that rising infrastructure costs will be offset by falling operational expenses, as AI agents replace human engineering headcount. While directionally plausible, this framing overlooks a critical shift in the risk profile of their cost structure. The transition from hiring engineers to deploying large-scale compute infrastructure is not a neutral substitution—it replaces variable operating costs with fixed, capitalized costs, fundamentally altering operating leverage.
In the software era, an important cost driver was R&D headcount — a flexible cost structure that could be adjusted via hiring freezes or layoffs in response to demand shocks. In the AI era, the primary incremental cost drivers are Depreciation & Amortization (D&A) derived from massive investments in data centers, networking equipment, and accelerators. Unlike salaries, depreciation schedules are rigid. Once tens of billions of dollars are deployed into infrastructure, the associated expense is locked into the income statement for multiple years, independent of revenue conditions.
This shift materially raises the breakeven revenue threshold and introduces asymmetric margin risk. As capital intensity rises, revenue growth must remain sufficiently strong simply to absorb fixed depreciation charges. If growth decelerates — even modestly — the inability to reduce these fixed costs causes operating leverage to turn sharply negative. The data already show early signs of this rigidity. While headline operating margins have continued to expand, free cash flow margins have deteriorated meaningfully, indicating that rising depreciation and maintenance capex are absorbing the savings from headcount reductions.
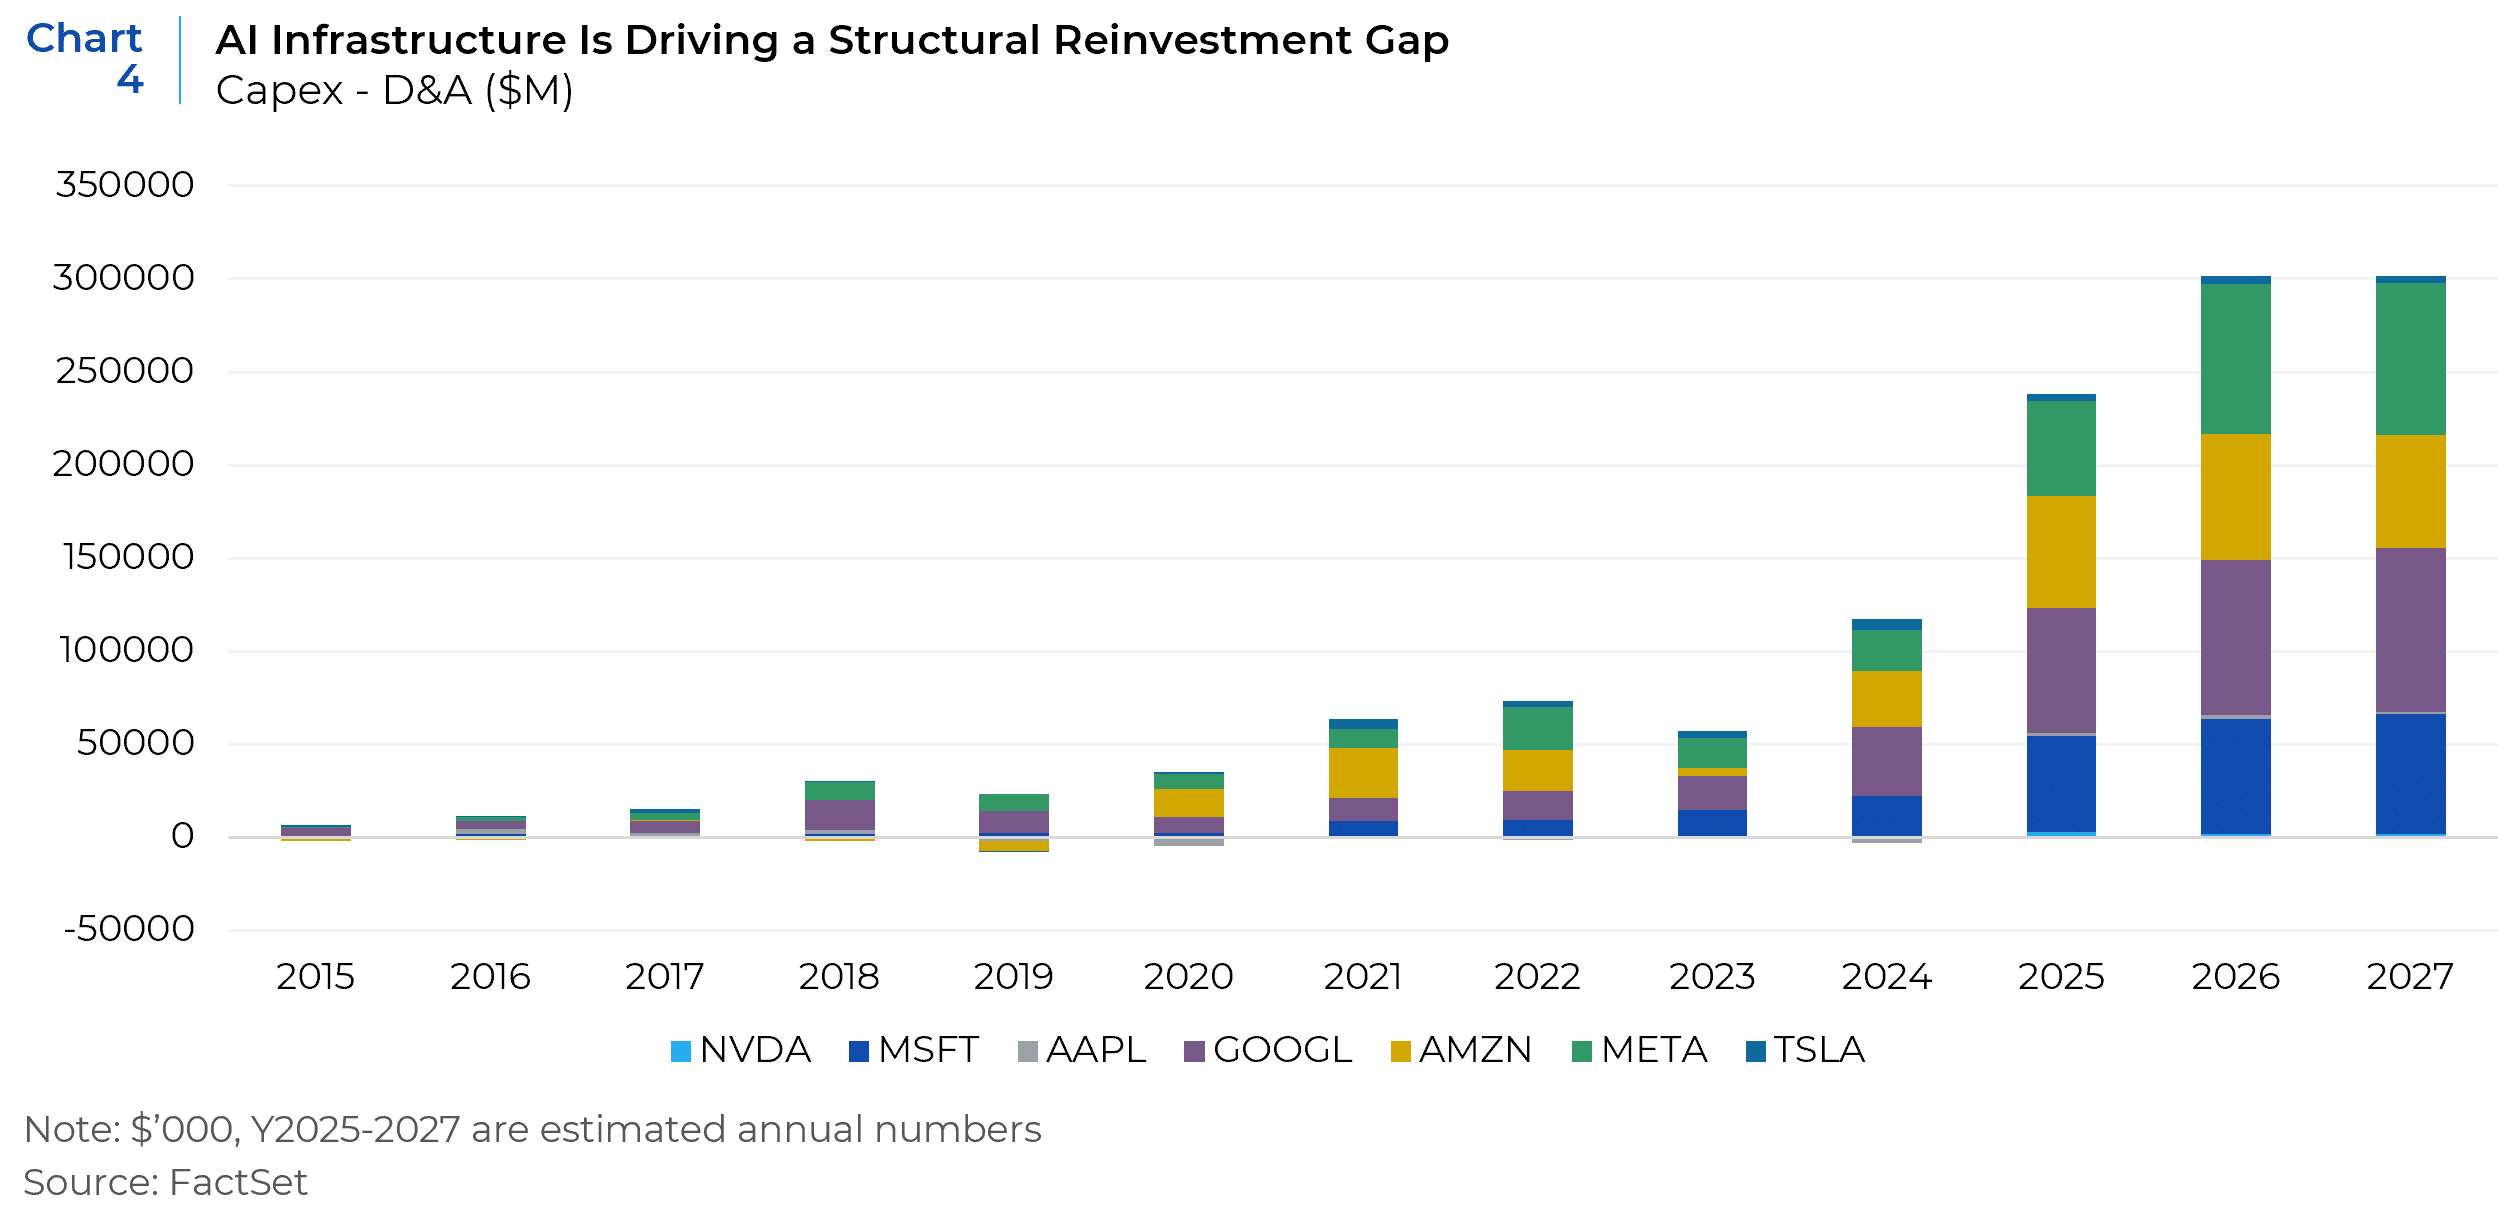
This hardening of the cost structure increasingly resembles the “Shale Tech” dynamic observed in the energy sector: a phase of rapid technological progress and capacity expansion that coincides with deteriorating free cash flow. The evidence is visible in the widening gap between capital expenditure and depreciation. Across infrastructure-intensive platforms, Capex has persistently and increasingly exceeded D&A (Chart 4), implying that reported earnings understate the economic depreciation/reinvestment burden of maintaining and expanding AI infrastructure.
This dynamic also explains why reported earnings and earnings-based valuation metrics remain deceptively resilient. AI infrastructure assets are typically depreciated over long accounting lives, even as their economic usefulness—particularly accelerators and compute hardware—erodes far more quickly. The result is a systematic lag between economic depreciation and accounting expense, allowing margins and net income to appear stable while the true reinvestment burden rises. In this environment, earnings-based multiples such as P/E increasingly reflect accounting conventions rather than underlying capital efficiency.
As AI hardware cycles shorten and replacement intensity rises, maintenance capex accelerates alongside reported earnings. This creates a durable wedge between Net Income—smoothed by accounting depreciation—and Free Cash Flow, which reflects the true reinvestment burden. Importantly, this gap does not normalize over time; it expands. Chart 5 shows between 2023 and 2025, median operating margins for mega cap technology companies rose from ~33% to ~38%, while free cash flow margins declined from ~28% to ~21%, producing the largest divergence. The risk is therefore not near-term unprofitability, but rising capital inefficiency: a regime in which sustaining current margins and revenue growth requires ever-larger, recurring capital outlays.

Reassessing Long-Term Profitability: The Great Bifurcation
The industrialization of the asset base effectively breaks the Big Tech monolith. Investors can no longer rely on a unified factor bet on Growth. Instead, the sector is splitting into two distinct business models based on their exposure to the Cost of Intelligence. The critical differentiator is not the size of the Capex spend, but the pricing power of the output. We must analyze these firms not as single names, but as collections of business lines with diverging economics: those that sell compute (The Renter Model) and those that consume compute (The Builder Model).
The “Renter” business model—best exemplified by the public cloud segments of Amazon (AWS), Microsoft (Azure), and Google (GCP)—faces a distinct “Commodity Risk”. Their primary AI revenue stream is derived from selling raw compute or API access, a service that is becoming structurally deflationary. The broader market for “Commodity” intelligence has collapsed.
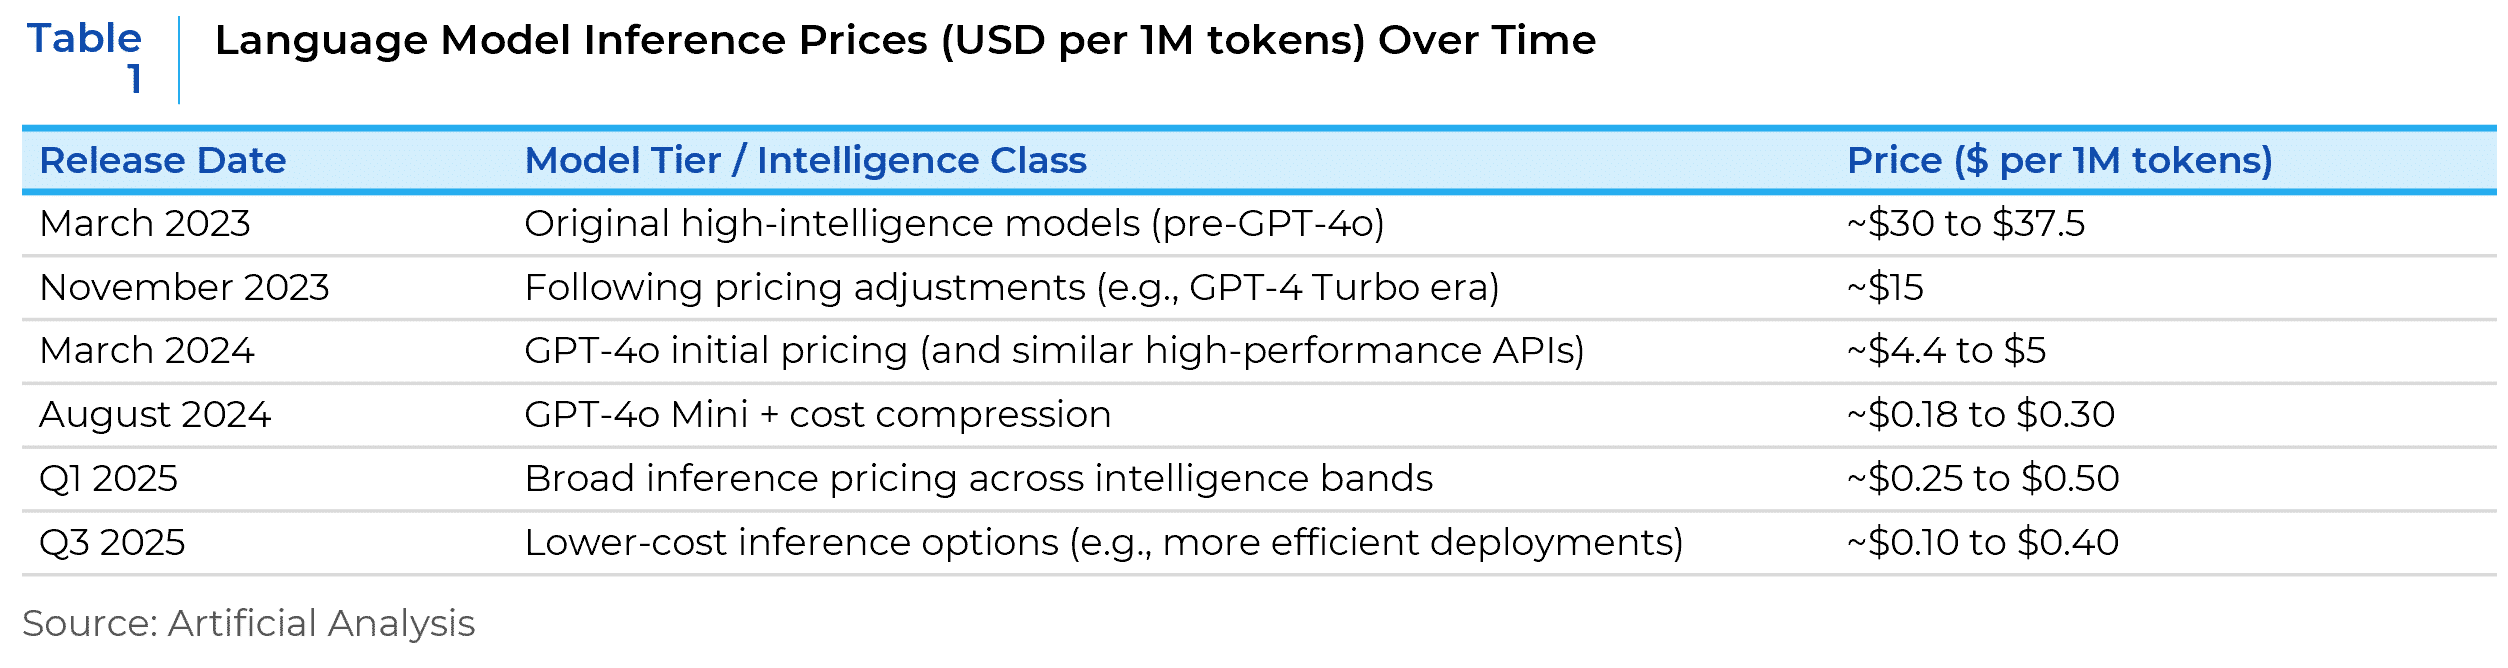
Public API pricing illustrates the scale of this deflation. Early GPT-4 pricing was commonly cited at around $30 per million input tokens in 2023. By early-2025, OpenAI’s broad inference pricing was at $0.25-$0.50 per million input tokens, showing a ~99.5% price decline in two years (Table 1).
This creates a difficult equation for the Cloud segments: they are deploying massive capital into hardware that depreciates in a few years, only to sell a product whose market price is racing toward zero. In this environment, revenue growth is a false signal of health; the vital metric is the stability of segment-level operating margins against a deflationary tide.
Conversely, the “Builder” business model—represented by Meta’s Family of Apps, Apple’s Hardware ecosystem, and Amazon’s Retail logistics—benefits from this dynamic. These segments are consumers of compute, not sellers. For Meta, a 95% drop in the cost of inference is not a loss of revenue; it is an efficiency windfall. It allows them to deploy advanced AI agents to curate feeds, target ads, and moderate content at a fraction of the historical cost, effectively widening the operating margins of their core advertising monopoly. Similarly, Apple utilizes “Private Cloud Compute” not as a revenue center, but as a defensive moat to entrench the iPhone ecosystem. Because they monetize the hardware or the user attention rather than the token itself, they are insulated from commoditization of their business model.
This framework suggests a new “Sum of the Parts” valuation approach for the mega cap tech names. Amazon, for instance, operates a massive internal arbitrage: it uses the cash flow from its Renter business (AWS) to subsidize the AI efficiency of its Builder business (Retail). The risk for investors is no longer just “growth,” but capital efficiency. As the cloud segments begin to resemble cyclical industrials—where returns are dictated by supply-demand imbalances in physical capacity—valuation multiples for the “Renter” revenue streams must compress, while the “Builder” streams justify a premium for their defensive, sovereign nature.
This report is neither an offer to sell nor a solicitation to invest in any product offered by Xponance® and should not be considered as investment advice. This report was prepared for clients and prospective clients of Xponance® and is intended to be used solely by such clients and prospective clients for educational and illustrative purposes. The information contained herein is proprietary to Xponance® and may not be duplicated or used for any purpose other than the educational purpose for which it has been provided. Any unauthorized use, duplication or disclosure of this report is strictly prohibited.
This report is based on information believed to be correct but is subject to revision. Although the information provided herein has been obtained from sources which Xponance® believes to be reliable, Xponance® does not guarantee its accuracy, and such information may be incomplete or condensed. Additional information is available from Xponance® upon request. All performance and other projections are historical and do not guarantee future performance. No assurance can be given that any particular investment objective or strategy will be achieved at a given time and actual investment results may vary over any given time.