
Non-US banks in developed markets (“EAFE banks”) have quietly emerged as the top-outperforming segments in global equity markets over the past three years (through Q1 2025). This paper explores the fundamental development of EAFE banks over the past decade, dissecting by European and Japanese entities.
In summary, EAFE banks have significantly improved both their balance sheet strength and profitability during this period, with Return on Equity (ROE) notably spiking since 2022. Despite an +80% return over the past 3 years, EAFE banks remain cheap relative to their US peers.
Our analysis of institutional exposure data (source: Nasdaq eVestment) reveals that EAFE managers, on average, have reduced their relative allocations to banks since early 2022. This circumstance, mostly driven by EAFE Value managers, has proved to be a significant performance headwind for those firms given the recent performance of the industry. Conversely, EAFE Growth managers have slightly increased their relative exposure to the industry, lending themselves opportunistic tailwinds.
We further assess how our active managers currently view and position their portfolios on EAFE banks, along with their outlook for the industry.
European Banks
European banks have been in the spotlight lately, becoming the best-performing industry within the EAFE universe since 2022, even outpacing US Technology stocks (see Chart 1).

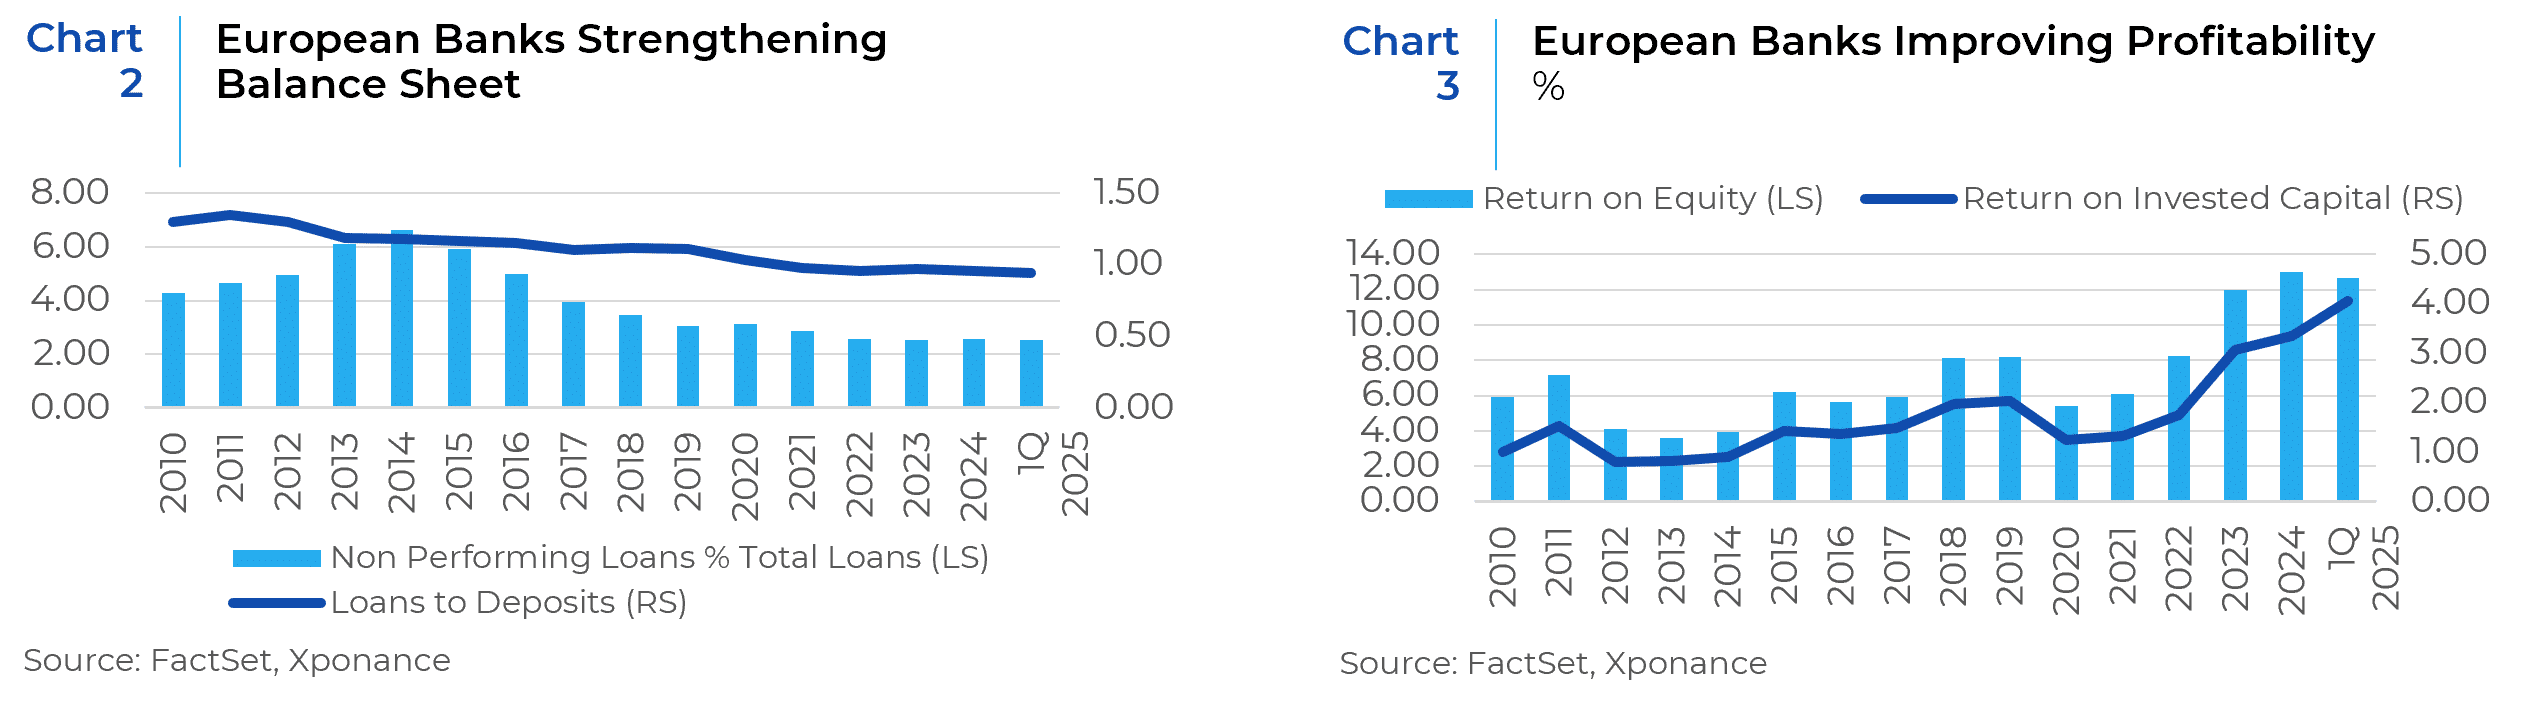
European banks have been steadily reducing Non-Performing Loans (NPL) ratios for the past decade. During this time, ROE, Dividend Yield and Earnings Growth have also improved, especially since 2021 (see Charts 2-4).

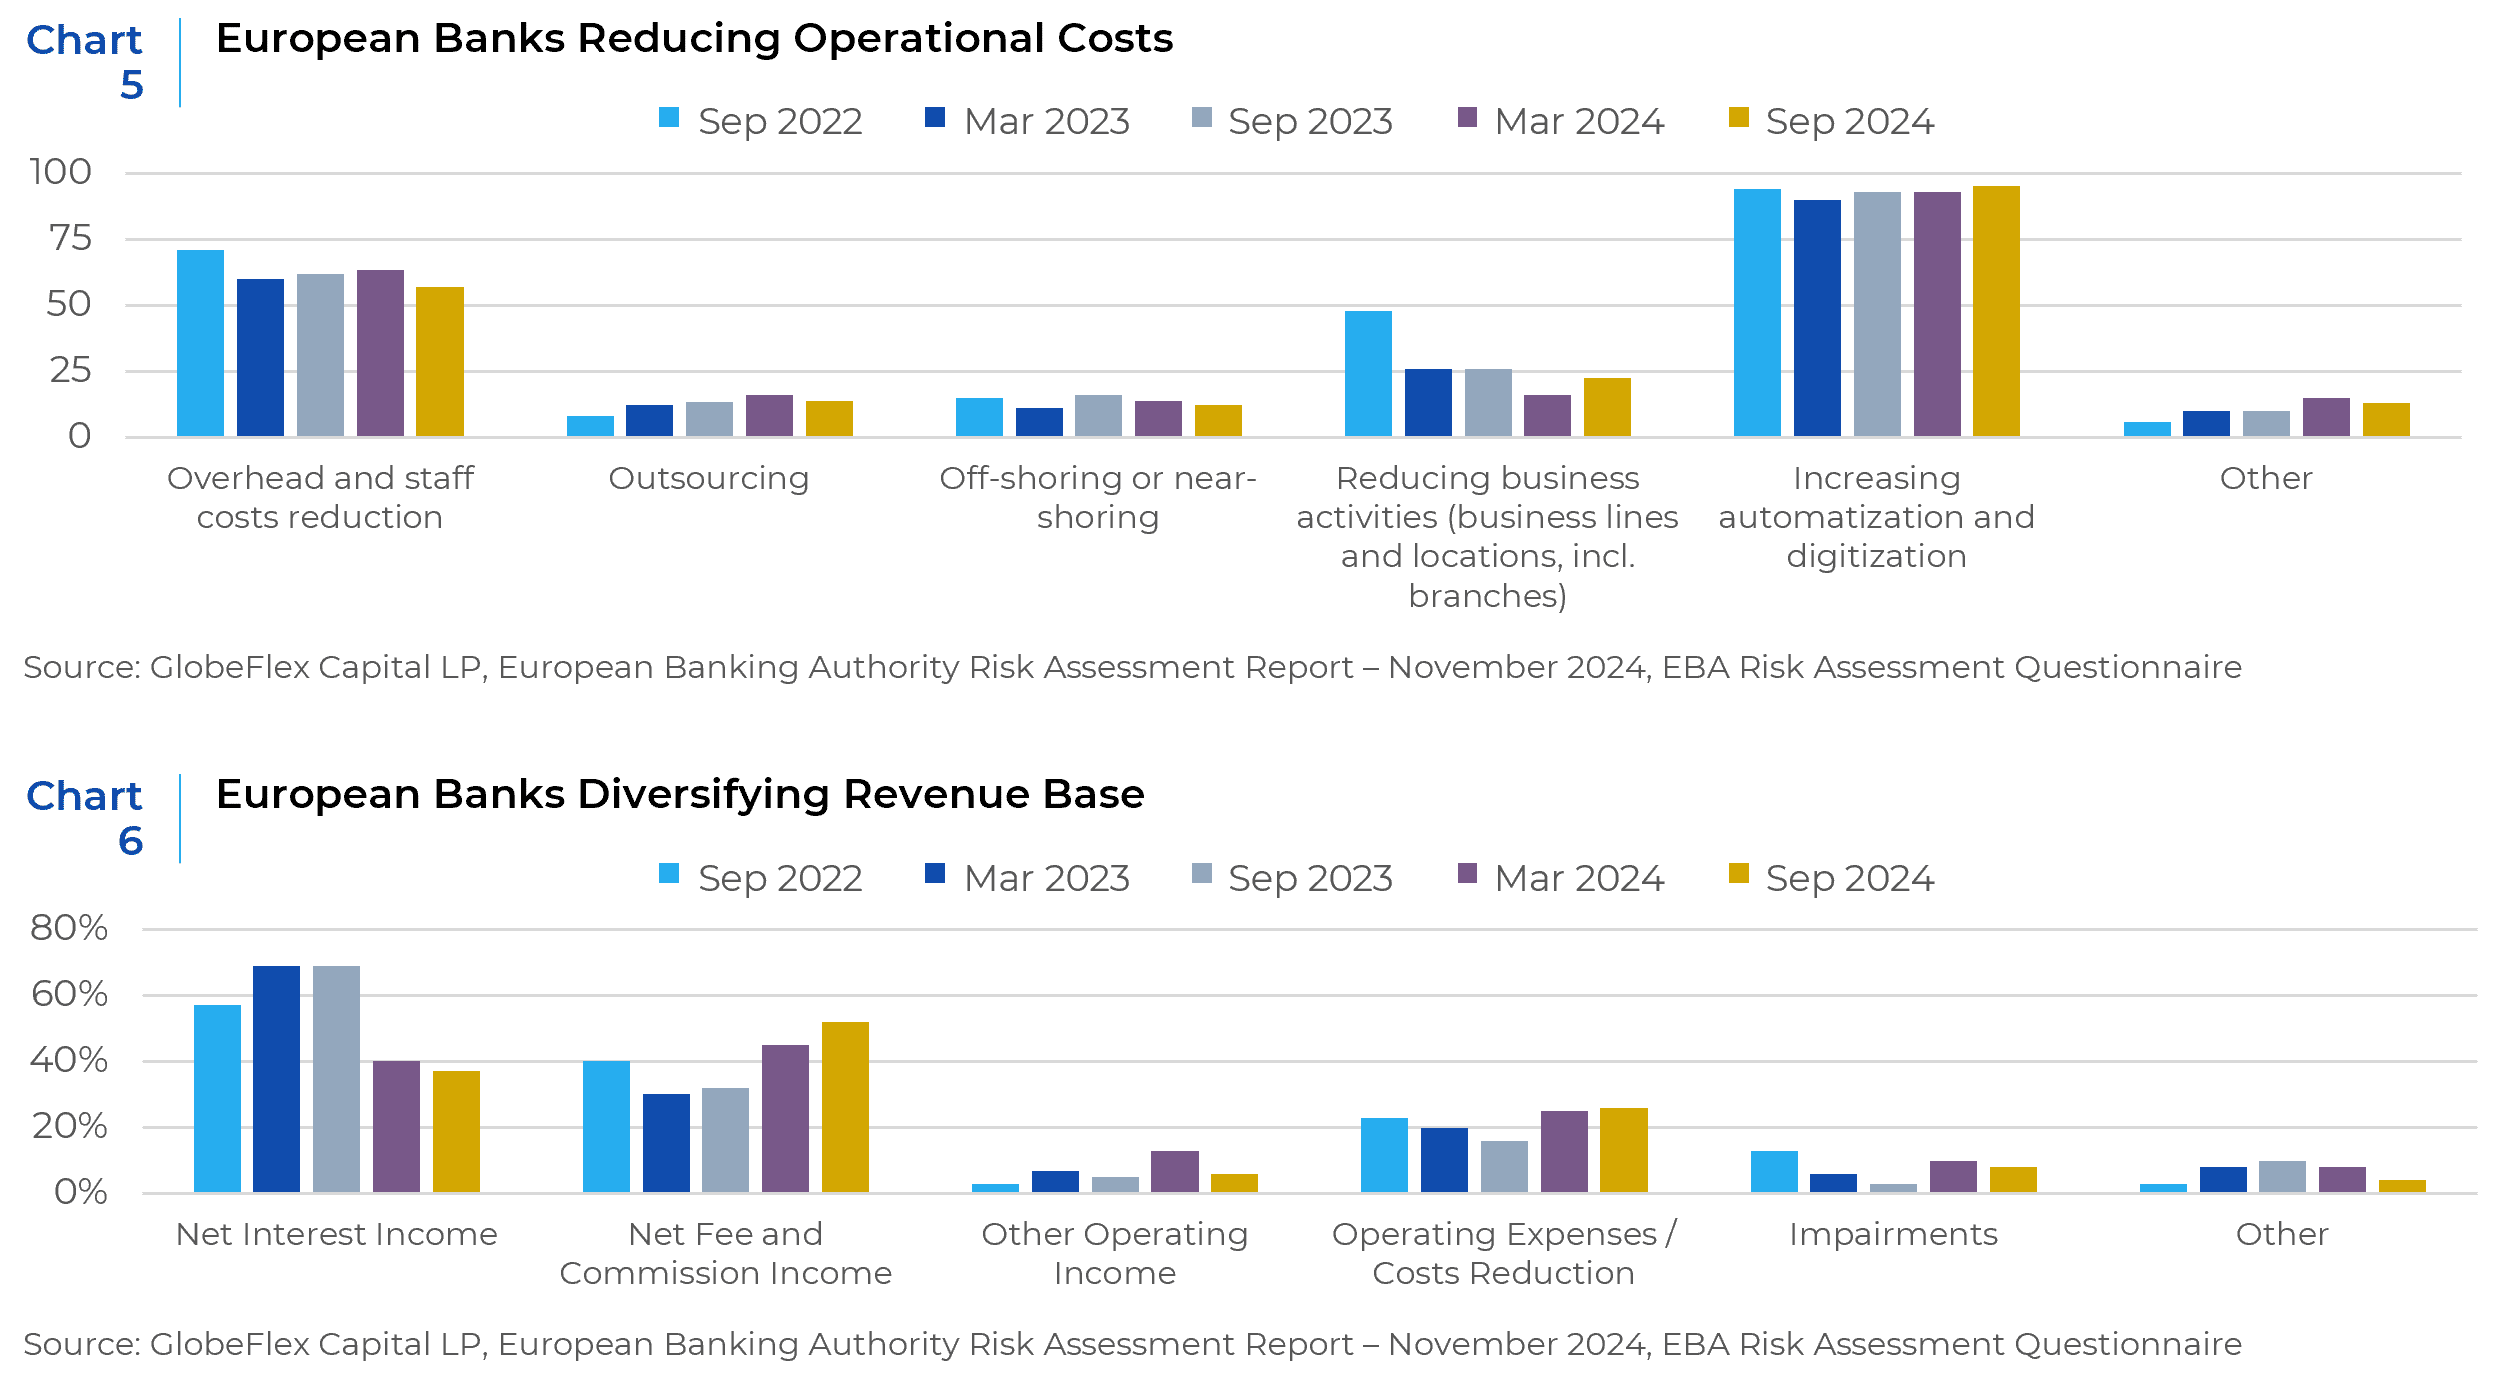
The European banking industry’s transformation reflects some cyclical tailwinds and more importantly, fundamental restructuring and enhanced regulatory discipline. According to GlobeFlex Capital LP, a global equity boutique manager based in San Diego, “European banks are spending more on digital platforms and automated lending processes, thereby reducing operational costs in order to maintain and improve profitability (see Chart 5). Furthermore, European banks are increasingly diversifying their revenue base by expanding fee-based income, with major institutions emphasizing this strategy in earnings calls. This shift helps mitigate reliance on traditional lending, ensuring greater revenue stability amid changing economic conditions (see Chart 6).”1
Despite improved profitability, European bank valuations were very depressed through 2022, trading around 0.7x P/B. Even after an 80% price rally over the past 3 years, they still trade around 1x price-to-book (P/B) as of Q1 2025, about 30% discount relative to their US peers (see Chart 7 and Chart 8).

Japanese Banks
Japanese banks tell a similar story of structural improvement. Since 2020, ROE for the Japanese banking sector has doubled, supported by a gradual rise in interest rates and a broader trend of improving corporate fundamentals in Japan (please see our previous paper This Time Is Different in Japan: Part 2). Unlike their European counterparts, Japanese banks have seen stronger investor recognition of these improvements, with their price-to-book (P/B) ratios also doubling over the same period.

How Have EAFE Managers Been Allocating to EAFE Banks in Recent Years?
To understand how these developments have influenced active portfolio management, we analyzed 373 EAFE large-cap and all-cap portfolios in the eVestment database from 2022 to 2024, including 57 EAFE Growth strategies and 99 EAFE Value strategies.
Overall, EAFE managers have modestly reduced their relative exposures to banks in recent years, which was entirely driven by the Value managers who more than doubled their underweight positions relative to the EAFE Value index (see Chart 10). Given the strong performance of the banking sector and its sizable representation within the EAFE universe, this underweight position resulted in a significant performance drag for those Value strategies.

In contrast, EAFE Growth managers have gradually increased their relative exposure to banks, relative to the EAFE Growth index, especially those focused on the change of growth instead of static growth thresholds. For these managers, this dynamic, opportunistic approach has proved beneficial compared to growth manager peers who typically exclude banks from their initial universe due to traditional quality or growth screens.
Actionable Takeaways – Many investment strategies include a “High Quality” screen in their investment process. EAFE banks have been traditionally rated as lower quality (characterized by low profitability, high leverage and opaque, policy-driven earnings). However, it is clear EAFE Banks have steadily, and visibly improved their “quality” for the past decade, while overall valuations remain deeply discounted. Active managers who exclude banks based upon historical perceptions of quality risk overlooking a sector that has both delivered substantial returns and is becoming increasingly relevant within the broader EAFE index. Allocators should spend time ensuring that these investors have the depth of knowledge to properly evaluate this evolving opportunity set that has been much less important to quality focused managers.
Views from Our Managers (surrounding the following questions):
- Has your view on EAFE banks changed in recent years? Do you believe this time is different?
- What is your portfolio’s exposure to EAFE Banks currently compared to historical norms?
- What’s your outlook in the EAFE banking sector for the near (6-12 months) and long (+1 year) term given the recent rally in prices? How do you compare the fundamental outlook for European banks to other developed markets (Japan and US in particular). Do you believe the current valuations reflect that outlook?
Relative Value – Global Equities Boutique

Gilman Hill Asset Management (New Canaan, CT)
After seeing most rallies in EAFE banks end poorly in the last 15 years, we are reluctant to say that this time is different. However, there are notable differences from previous periods of outperformance. EAFE banks are in the strongest financial position in over 20 years, there have already been enormous upward revisions to earnings estimates, bond yields in Japan are at a 17 year high and we cannot remember the last time there was this much momentum around fiscal spending in Europe.
The near-term outlook for EAFE banks remains positive, supported by strong earnings momentum and attractive valuations. Forward earnings estimates have surged, up 36% for European banks and 39% for Japanese banks over the last year, helping keep P/E ratios at reasonable levels despite sharp increases in share price. Analysts have underappreciated the high operating leverage across the industry and sensitivity to key tailwinds, including stronger loan demand in Europe and rising bond yields. Upward revisions to earnings estimates are likely to continue. However, we believe that caution is warranted as a wave of hot money chasing returns in the industry raises the risk of sharp reversals, and the potential negative impact of tariffs could undermine what is otherwise a more constructive macro backdrop.
The long-term outlook for EAFE banks is more balanced, with a neutral view on the industry overall. While recent optimism has lifted sentiment, history reminds us that bank earnings are inherently cyclical, and today’s strong momentum may not be sustained. We believe that structural challenges in the industry (intense competition, demographic issues and higher costs) limit the potential for further rerating, meaning future returns will likely depend more on growth in book value and dividend income. That said, even the most successful banks often struggle to grow book value at a sustained pace exceeding 5% annually.
The key difference between Europe and Japan is the durability of these catalysts. Fiscal spending in Europe has greater visibility and will take many years to play out. In Japan, changes in interest rates are more volatile, particularly as inflationary pressures begin to weigh on consumers and early signs of slowing growth raise questions about the Bank of Japan’s commitment to raising rates.
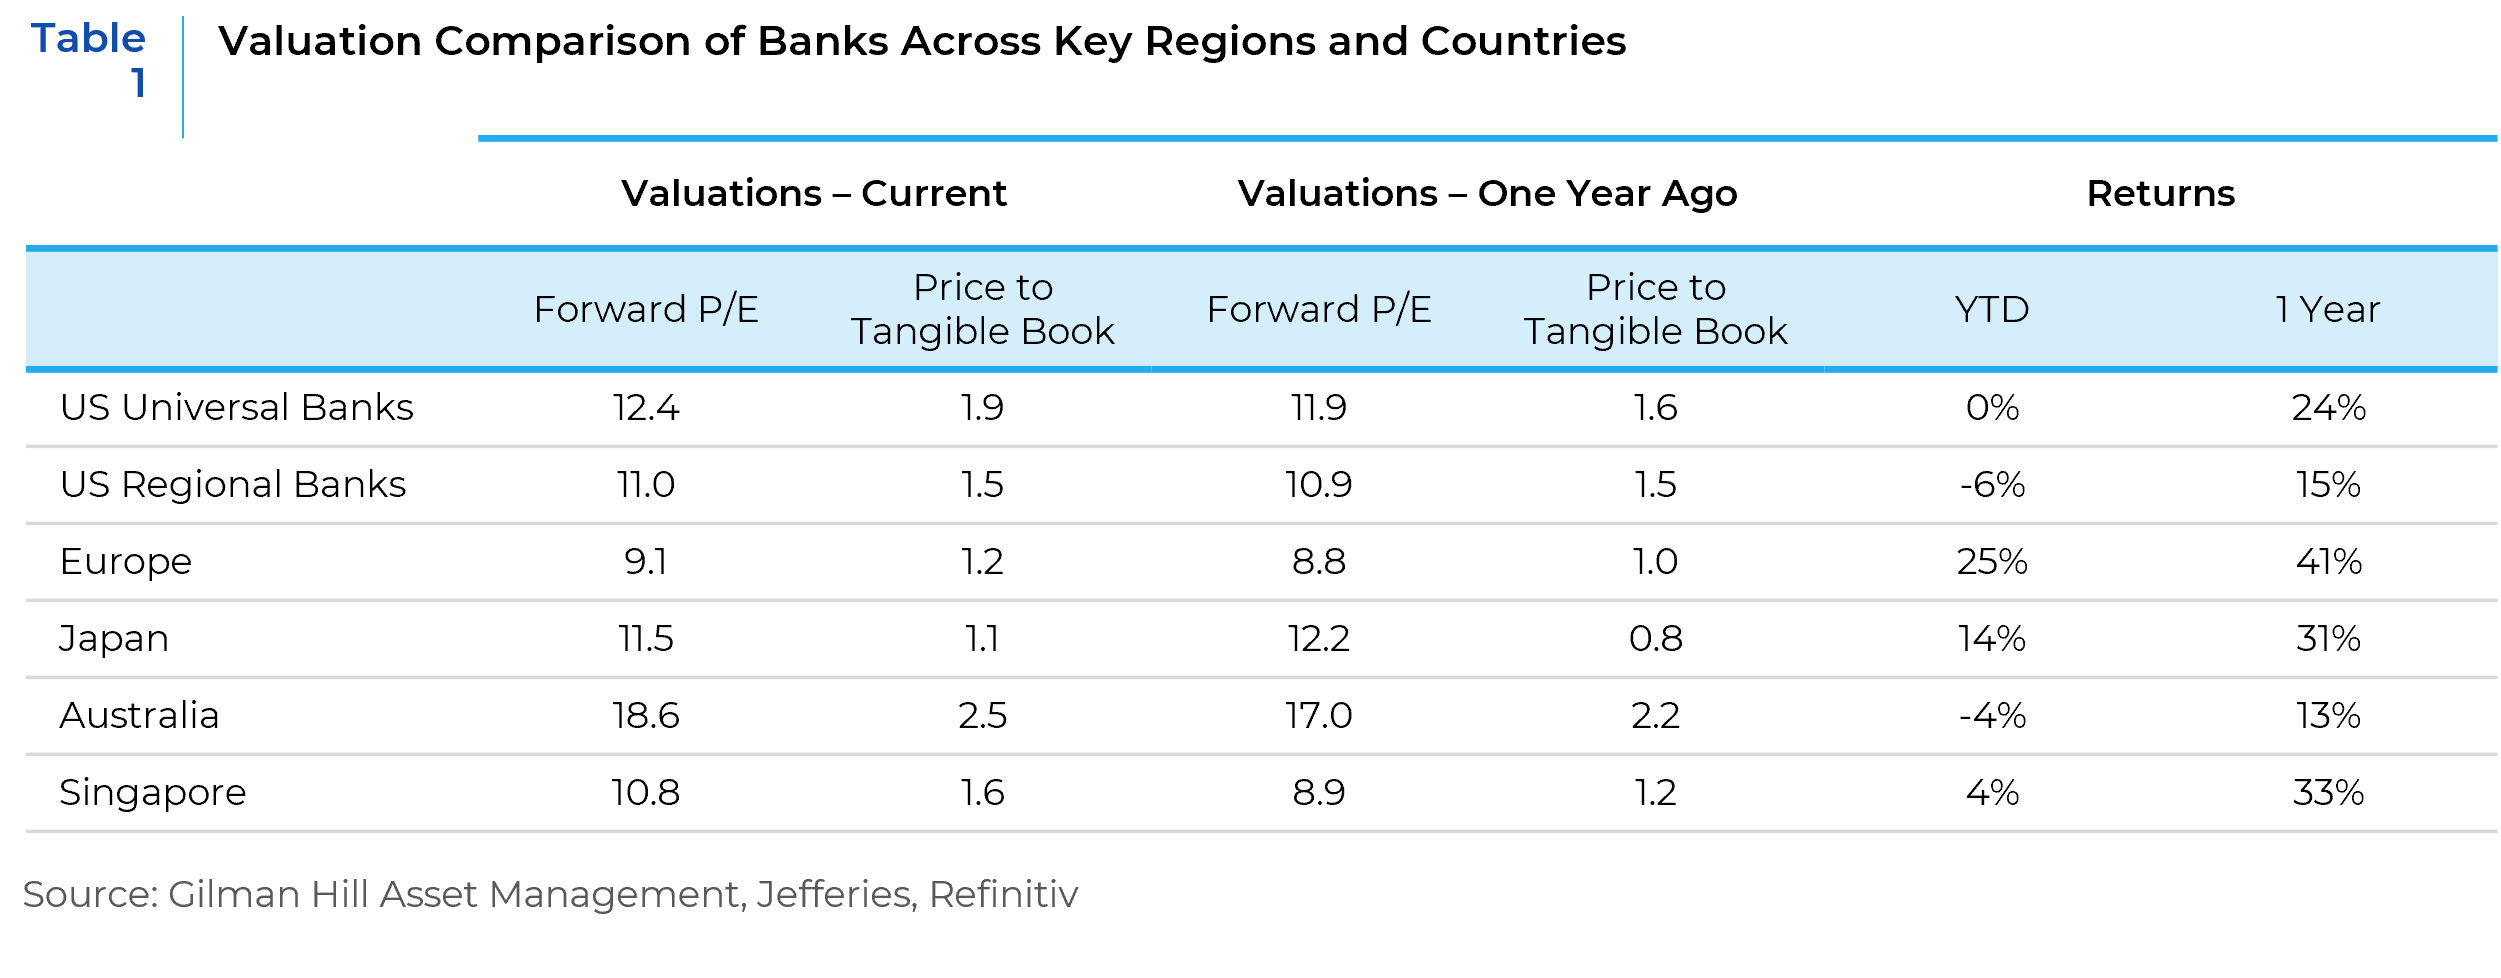
Looking further ahead, we believe that the structure of the banking industry will be a more important driver of returns than near-term macro trends. The U.S. banking sector continues to hold structural advantages, including greater scale, more flexible cost structures, and higher underlying economic growth, which position it more favorably in a normalized environment. As a result, we continue to believe that European and Japanese banks should trade at a discount to U.S. peers on a price-to-book basis, although the gap may be narrower than we have seen historically. Large banks in the US trade at 1.9x book value, as compared to 1.2x and 1.1x in Europe and Japan, respectively. In contrast, banks in other large markets such as Singapore and Australia, where industry dynamics are more favorable, should trade closer to parity with U.S. banks. Currently, Australia has a premium valuation at 2.5x book value and Singapore trades at 1.6x.
Relative Value – International Equities Boutique

Bayard Asset Management (Princeton, NJ)
The P/E discount between European and US banks has contracted from c.40% at the peak a few months ago it is still substantial at 25-30%, despite comparable or better underlying fundamentals for the European banks at the current points in their respective cycles.
As such, these valuation discounts seem particularly extreme in light of declining risks relating to net interest income growth in European banks. A sharply steeper yield curve in recent months, and the possibility of greater fiscal spend, and debt issuance has put a floor under interest spreads and net interest margins for the European banks. Additionally, upside risks have emerged due to signs of positive loan growth in recent months in most European markets – a trend that may well accelerate over time, with the broad fiscal impulse currently underway.
On the negative side of the ledger we note that most of these positives have now become quite well recognized and while we share a medium to long-term optimism around closure of the discount to valuation gap, we are concerned that a sharper slowdown in the US economy and its commensurate impact in economic activity around the world is not fully discounted in cyclical sectors, such as European banks.
All told, on balance, we are sticking with our current positive stance towards European banks as we feel the valuation gap, and structural long-term tailwinds more than balance the presently low (and indeterminate) risk of a somewhat deeper US slowdown.
Aggressive Value – International Equities Boutique

Ballina Capital (El Segundo, CA)
Today we are still a bit more skeptical than the market about the reliability of the earnings streams of many of these Italian, German, UK and Japanese banks that compete in oversupplied low growth markets. No matter the sector, we try to avoid buying companies on peak profits.
We would be nervous about macro conditions shifting for many of these institutions. We do not have a precise view of when that shift would take place. When we were more constructive on EAFE banks, it was not difficult to find a quality bank at 40% of tangible book value. Our sense is that this price floor has moved to about 85% of tangible book value. When you add in some quality constraints, this price floor moves above 100% of TBV to possibly as much as 120% of TBV. The downside protection seems to have lessened considerably.
Aggressive Value – Global Equities Boutique

Huber Capital Management (El Segundo, CA)
Our portfolio reflects a slightly higher allocation to EAFE banks compared to prior years, driven by increased exposure to the UK and select developed continental European markets. We believe excess capital above regulatory thresholds within the banking system should serve as a catalyst for cross-border strategic mergers, with the resulting accretion ultimately benefiting shareholders via enhanced payout yields. We believe such transactions could materialize within the next 6 to 12 months, and we anticipate continued updates from bank management teams regarding the timing and scale of excess capital return programs over the medium-term.
We are gradually reallocating the portfolio towards geographies with lower interest rate sensitivity to their deposit bases. For instance, over the past 3 years we have maintained an overweight position in Italian banks, which benefited from strong capital ratios, robust shareholder return programs, and structurally low deposit betas relative to the broader European banking sector. Italian deposit betas for most of 2023 were observed at only 10% v. deposit betas in other European geographies at up to 50%. This structural difference supported outsized net interest income growth in Italy v. peers. In the near-term we are reallocating our Italian banking overweight to the rest of Europe as deposit betas may represent a potential headwind in Italy should interest rates decline in future periods. We believe banks in the UK and more developed continental European markets are relatively attractive, both from a valuation standpoint and based on normalized earnings power when accounting for expected changes in the yield curve.
Aggressive Growth – International Equities Boutique

CastleArk Management (Chicago, IL)
Our International portfolio currently is overweight EAFE banks relative to the ACWI-ex US index. The majority of the overweight is in Japanese banks, and we have a slight overweight to the European banks as well. Historically, the portfolio had no exposure to Japanese banks and was underweight in European banks. Starting in 2022, positions in Japanese and European banks were initiated and currently we are overweight in both Japanese banks and European banks this year.
We have a positive outlook for the EAFE banking sector both near and long term. We see that the benign credit environment will continue in the near term and will be manageable over the longer term as banks’ risk controls have been greatly improved. Japanese banks have the benefit of rising interest rates, fueling continued net interest margin expansion and overall profitability. This higher capital generation will support the increased shareholder return. European banks have significant excess capital, and we expect M&A and shareholder return trends to strengthen as they use their capital more efficiently to become more profitable against the backdrop of subdued organic growth. The recent share price rally partially reflects our positive outlook; however, we believe that there is a further 15-20% increase as the valuation gap narrows between EAFE banks and US banks.
Aggressive Growth – Global Equities Boutique

Ravenswood Partners (Mclean, VA)
We struggle to find banks that meet our criteria in Europe and Japan. While rising rates across Europe and Japan have re-set NIMs (net interest margins) and profit margins higher, this was a largely one-off event. Banks in both markets must now comp these rate benefits even as the bolus of growth benefit is already in the past. For instance, the average Japanese bank EPS grew 31% this year, but will fall by more than half to ~13% over the next two years. The growth outlook for Europe is even poorer. Equity markets are already pricing in above-average growth, with both indices re-rating significantly to their highest levels since 2009, and 2/3rds and 1/3rds above their 15-yer average in Japan and Europe respectively. Future earnings power and upside/downside to estimates will be driven largely by rate and economic growth expectations, which we have no edge in predicting. Japan has a more interesting structural story, as it relates to banks winding down crossholdings and selling stakes in client companies to pursue accretive M&A, but picking acquisition targets is not our circle of competency. The European bank rally appears to have less fundamental underpinning, driven more by portfolio rebalancing out of growth and US equities this year. Torrid re-rates over the last 18 months have driven the majority of stock outperformance, which we view as difficult to sustain.
Core Growth – Global Small Cap Equities Boutique

Lizard Investors (Chicago, IL)
It’s important to note the difference between large and small cap banks in Europe, as Europe and UK don’t have the deep regional banking infrastructure we enjoy here in the US. We split the European and UK publicly listed banks into two groups. We have a larger than $5bn market cap group and a $200m-$5bn group.

Above you notice the much higher returns on equity, multiple and better share price performance for large caps. In our view, this reflects the significant advantage large banks have in Europe on a structural basis over smaller banks. When allocating to these regions we think it’s important to distinguish this and we would continue to be more constructive on the larger banks in these regions as investors. These changes are early indications of a larger more favorable cycle beginning to play out in Europe. After struggling for the better part of almost two decades, an improving interest rates environment and rallying bank stocks are indicators this time could be different across the board for European equities as we may be seeing early indications of change of market leadership out of the US into other geographies.
While the interest rate environment is a little less clear in Japan, we believe the corporate reforms driving Return on Equity (ROE) targets have forced the banking system to become healthier and more profitable. We believe this has been the biggest driver of share price increases over the last several years. While we remain positive on Japanese banks, we think the impressive equity returns of the last several years will be challenging to replicate going forward as we would expect margin growth and ROE expansion to moderate. However, this trend is pervasive throughout Japan.
So where do bank stocks in Europe sit today and are they attractive? The Euro Stoxx Bank Index is trading at just over Book Value (BV) as of the writing of this document, at just over 1.02x BV. This is the first time the index has crossed this threshold since 2010. The question is can we see EU bank stocks return to their glory days over the mid-2000s where they traded at much higher multiples. Our view is that we would expect to see bank stocks break out but we don’t believe we will see the hefty 2x BV multiples from those days. Based on large cap banks making about 15% Return on Equity (ROE), we believe many could trade somewhere between 1-1.5x BV which still makes them reasonably attractive as long as the interest rate environment remains favorable.
Core – Global Equities Boutique

GlobeFlex Capital (San Diego, CA)
In conjunction with positive fundamental catalysts, European bank prices currently reflect a cautiously optimistic outlook. If these banks can translate initial optimism into steady earnings growth that is driven by persistent loan demand, improved risk management and regulatory reform, then current valuations could be maintained or even further enhanced in the long run. However, looming macro challenges – the possibility of slow GDP growth, geopolitical uncertainty and potential credit quality issues – pose a risk of heightened price volatility in European banks.
Domestically U.S. banks expect a rate cut scenario as the Federal Reserve plans to ease monetary policy in 2025. Declining interest rates will likely reduce NIMs and put downward pressure on net interest income (NII). However, banks expect non-interest income to grow, driven by increased fee-based revenue from wealth management, investment advisory, and payment services. Unlike their European counterparts, U.S. banks have not undertaken significant restructuring to reduce costs. Instead, they continue to invest in technology and improve business activity, which may push expenses slightly higher in 2025. Despite their efforts to maintain cost controls, this trend will likely keep the cost-to-income ratio flat. U.S. banks still expect moderate growth in return on equity, supported by diversified revenue streams.
This report is neither an offer to sell nor a solicitation to invest in any product offered by Xponance® and should not be considered as investment advice. This report was prepared for clients and prospective clients of Xponance® and is intended to be used solely by such clients and prospective clients for educational and illustrative purposes. The information contained herein is proprietary to Xponance® and may not be duplicated or used for any purpose other than the educational purpose for which it has been provided. Any unauthorized use, duplication or disclosure of this report is strictly prohibited.
This report is based on information believed to be correct but is subject to revision. Although the information provided herein has been obtained from sources which Xponance® believes to be reliable, Xponance® does not guarantee its accuracy, and such information may be incomplete or condensed. Additional information is available from Xponance® upon request. All performance and other projections are historical and do not guarantee future performance. No assurance can be given that any particular investment objective or strategy will be achieved at a given time and actual investment results may vary over any given time.