
Growth managers have been outperforming core benchmarks and value managers by a wide margin the past 3+ years (Chart 1). In this analysis, we dig a little deeper to see what investment approaches and product types have been successful in this market environment. Lastly, we use the historic drawdown of the 1st quarter and subsequent rebound as an opportunity to analyze the major and secondary drivers of performance during a non-financial market shock.
Chart 1
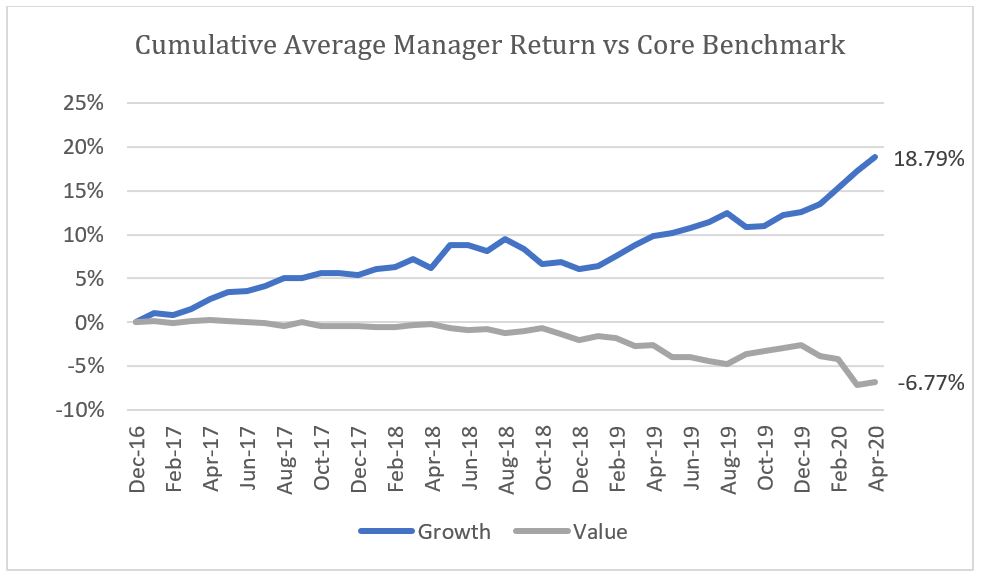
Universe: Evestment Active Non-US Equity Large Cap SMAs with all data points used in the study available, at least 60 months of history and returns available through March 2020 (261 products, 165 with April 2020 returns)Managers are grouped based on their Return based factor exposure to growth and value factor groups. The universe was split into thirds (Value, Core, Growth).
Skill or Style
Benchmark relative performance gives us a rough and noisy picture of manager performance. During times of extreme factor performance, the style of the manager will be the primary driver of performance vs a benchmark.
Chart 2 & 3
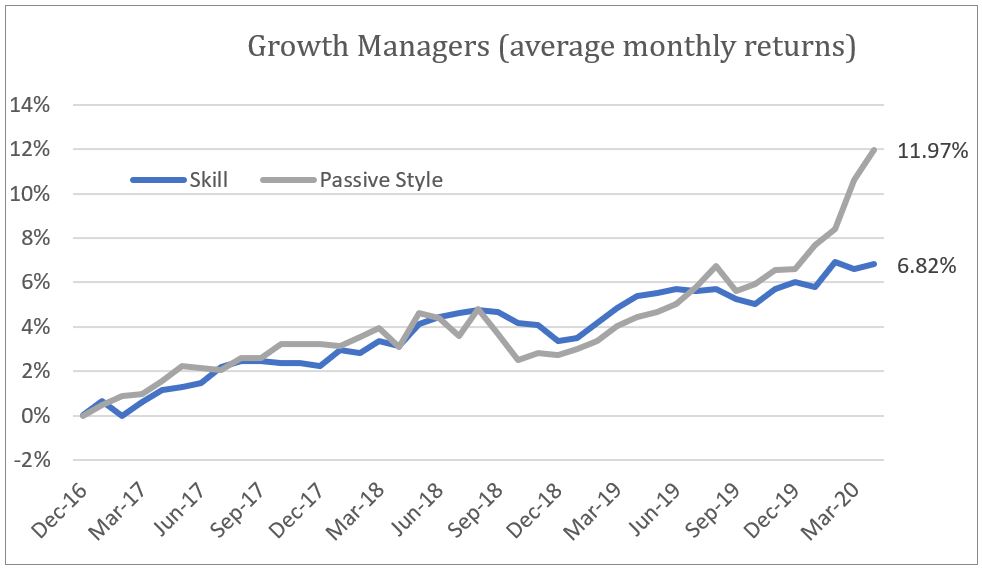
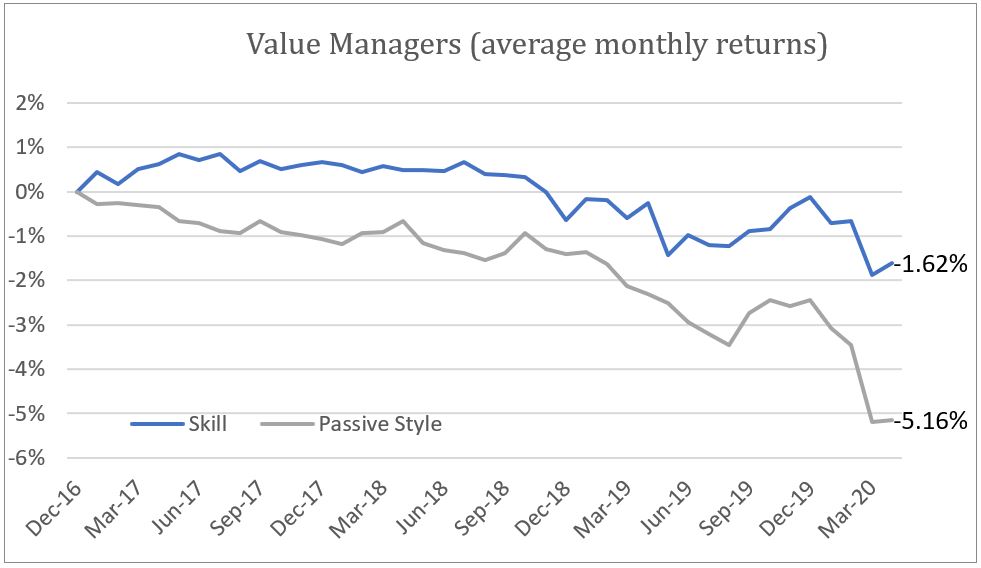
Passive style is the “clone” or passive style replication of a manager minus the benchmark returns. For more information on the methods used, please see https://knowledgebase.aapryl.com/glossary/clone-portfolio/
To judge the skill of a manager we back out the impact of their long-term style, by substituting a passive replication of each strategy for the benchmark. As you can see, growth managers had a 12% ‘head start’ vs value managers in beating a core benchmark due to the performance of the factors that underly their strategies (Charts 2 &3). Taking the styles into account, growth managers still added a tremendous amount of value through skill, while value managers failed to add value after accounting for their style.
Digging Deeper
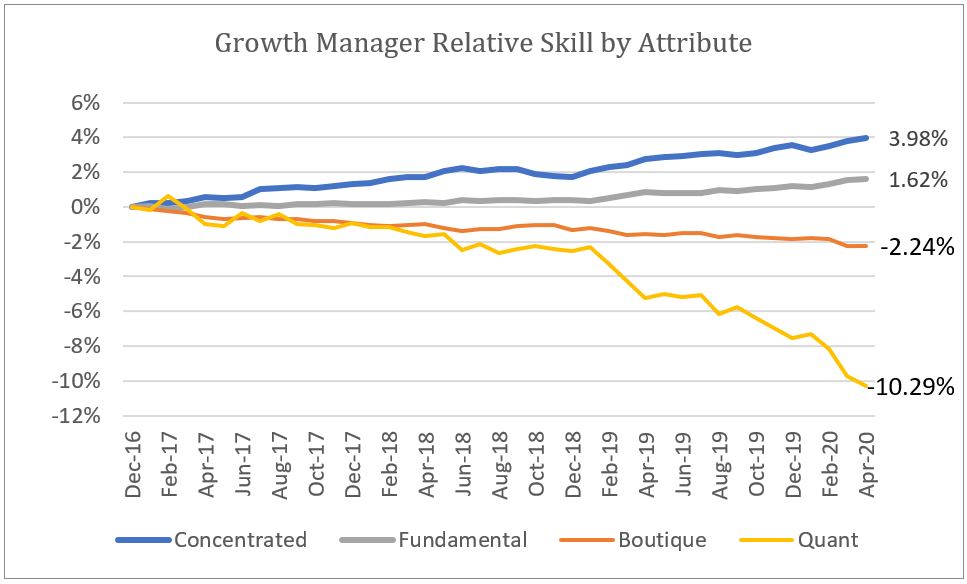
There are more aspects to an investment strategy than style. Below we break out some key attributes of managers and their strategies. The chart below compares managers with each attribute relative to the average skill in chart 2
Chart 4
Universe (see chart 1)
Quant vs Fundamental: Organized based on stated “Investment approach” in Evestment as of 3/31/2020
Boutique: All products with less than 1B$ as of 3/31/2020
Concentrated: Less than 60 holdings as of 3/31/2020
There are relatively few quantitative growth managers (15% of the universe), but they dramatically underperformed the average growth manager during the past 4 plus years. Boutique managers, which are smaller by definition and thus have a structural advantage in being able to invest across a wider spectrum of the investible universe, have also underperformed. This suggests narrow leadership in the largest and most liquid names in the universe, which has been the case for much of the period in question.
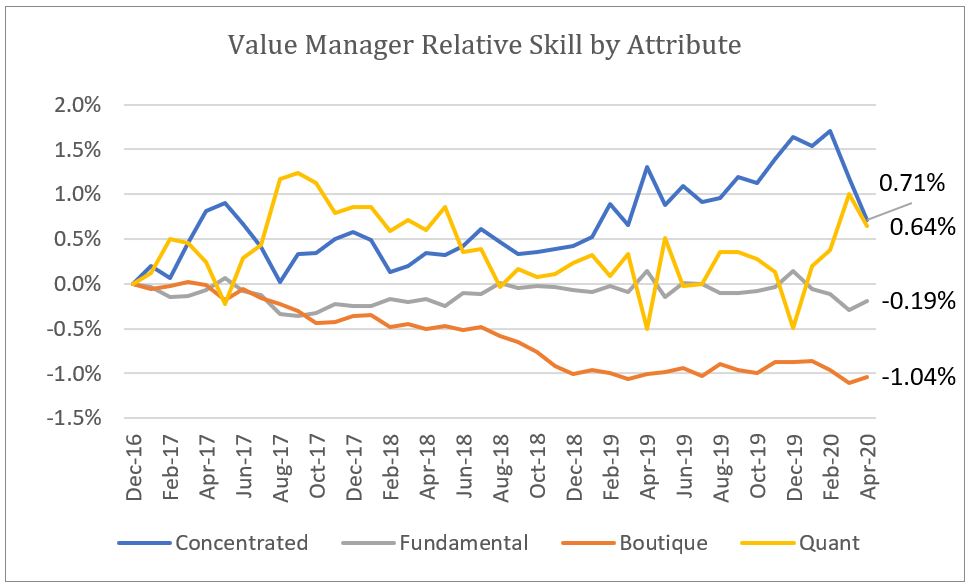
Among value managers, once again, small managers underperformed their larger counterparts. Quant managers proved the value of systematic risk management, adding 1.5% via skill from December through March.
Navigating recent market turmoil
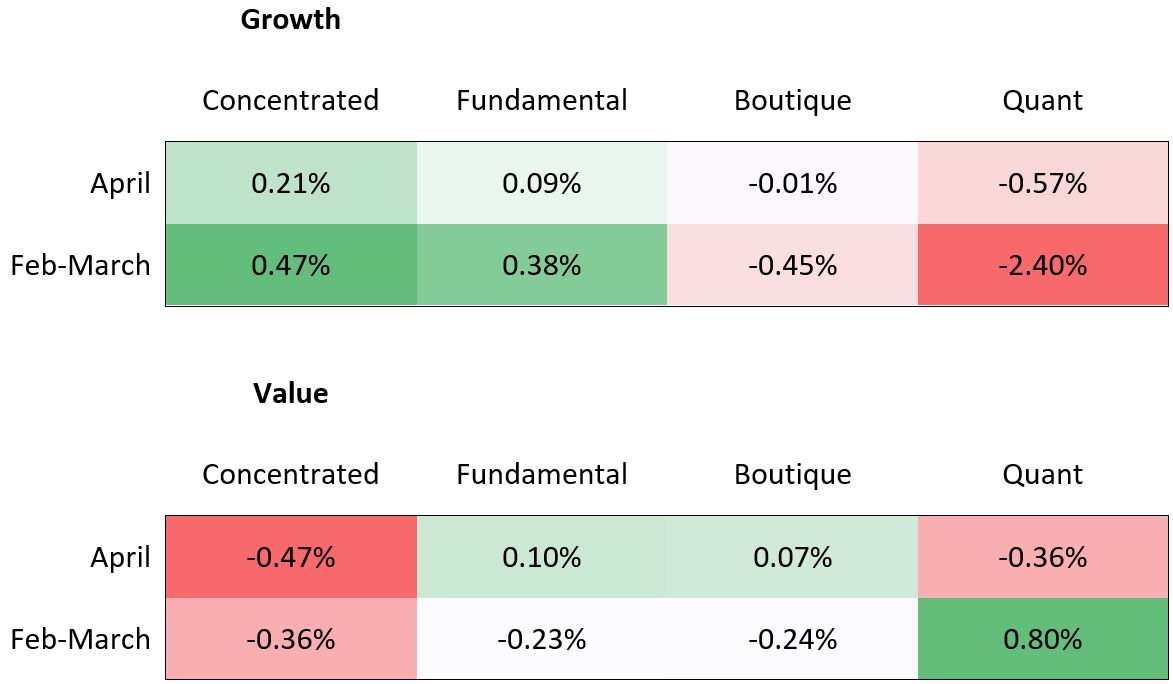
For value managers, quantitative approaches protected capital better during the market collapse in February and March, but they failed to keep pace when the rally came in March and April.
Concentration has been a headwind for value managers and a tailwind for growth managers. This is out of sync with our anecdotal view of long-term drivers of manager out-performance and will be the subject of forthcoming research in this area.