FORESIGHT | FIS VIEWS
I beg your pardon, I never promised you a rose garden...” — chorus from Lynn Anderson’s 1970 chart-topping country hit
We thought we’d use the latest FIS Foresights to introduce our findings from a 5-year research effort to evaluate the efficacy of various quantitative manager selection methods with the goal of refining our own quantitative screening methodology to be more predictive. Next year, we plan to provide a complete research report on this methodology. While we don’t promise roses, we believe that this methodology (which we are currently implementing into our own process) is more predictive of future manager success and stake our reputation on its efficacy.
In an article entitled The Morningstar Mirage, The Wall Street Journal recently took aim at Morningstar with a disparaging article about the efficacy of their mutual fund rating system. Morningstar quickly fired back a rebuttal stating that the company never claimed that its rating system is predictive of future performance, despite its widespread use as a means for selecting mutual funds. Rather than opine on their debate, we thought this would be a good opportunity to share some of the results of our multi-year research on quantitative screening methods that have proven to be predictive.
For background, as a fund of funds, our job is to pick managers whom we expect to provide excess return. To do so, we have developed a robust manager selection process which incorporates both qualitative and quantitative analysis rather than rely on the assessments of third parties. On the qualitative side, we interview managers to understand their approach to investing; we dive deeply into their backgrounds and qualifications; we study how they manage risk; and we look at their organizations to ensure that they will be worthy stewards of capital. While this is not nearly a complete list, we cite these examples to illustrate that assessing a manager is a time consuming task. Given that there are thousands of investment managers in our investable universe, it would be impractical for us to spend the time and resources required to qualitatively assess all of them.
This is where our quantitative analysis comes into play. The role of quantitative screening is to shrink the universe into a manageable size so that we can focus our time and energy studying the right managers. So while quantitative analysis is only a portion of our (and most research staff’s) manager selection process, it allows us to tip the scale in our favor by ensuring that we are looking at managers who give us the highest likelihood of success.
Unfortunately, we (and many other researchers) have found that many commonly used quantitative methods (such as information ratio and alpha rankings and indeed, Morningstar ratings) fall short of this basic goal. We have found that while these measures are extremely useful for characterizing a manager’s past performance, because of the cyclicality of style effects as well as the possibly outsized influence of pure luck, they have limited ability to predict future relative performance.
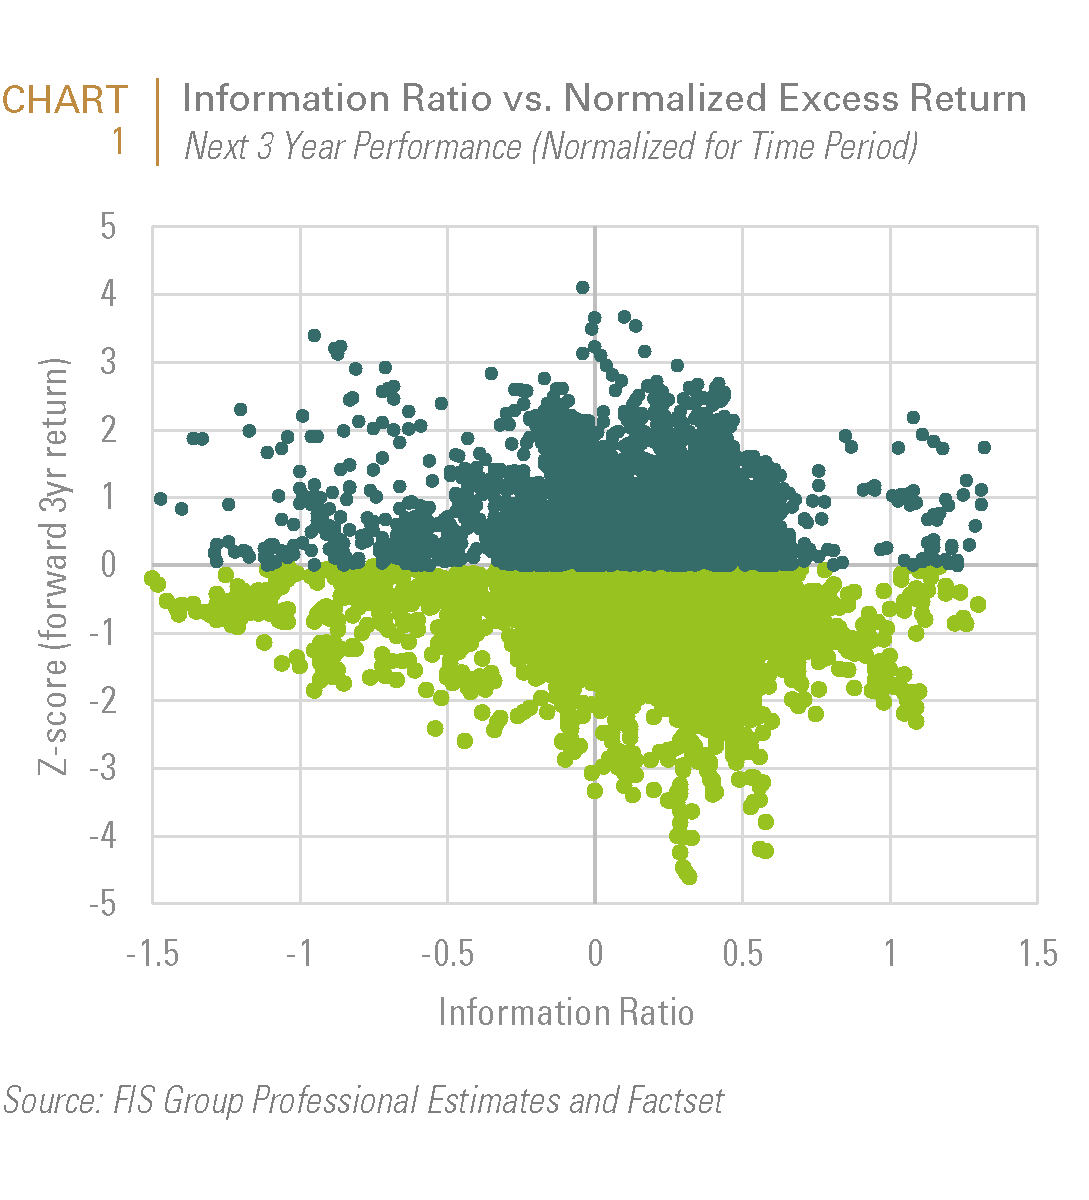
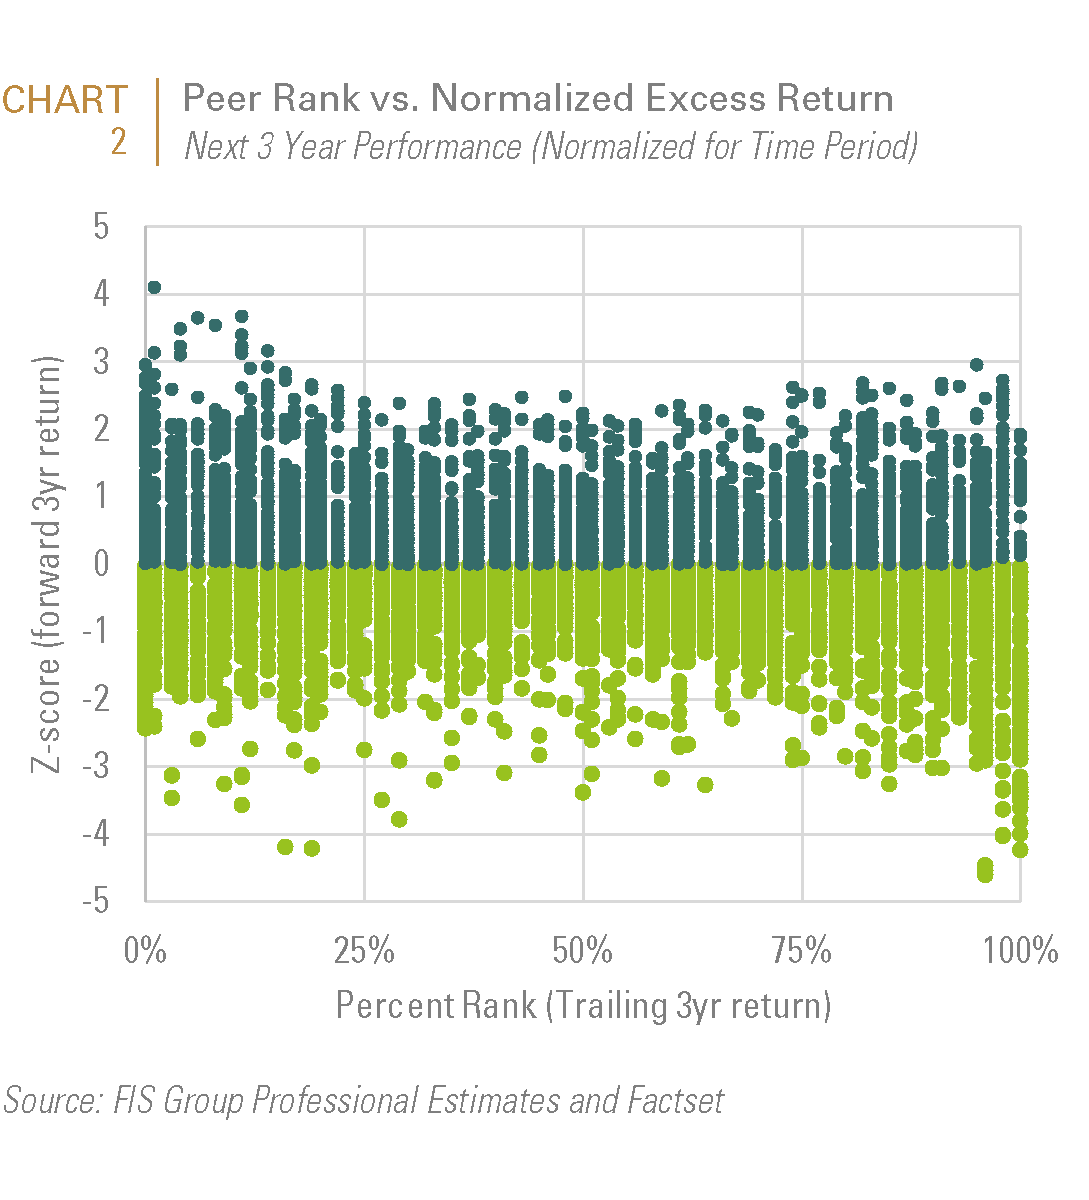
Chart 1 and Chart 2 below illustrate this point using two commonly used statistics, information ratio and peer group ranking. The charts, which respectively evaluate manager rankings for these measures relative to the Z-score of the manager’s subsequent three year return, demonstrate limited predictive ability.
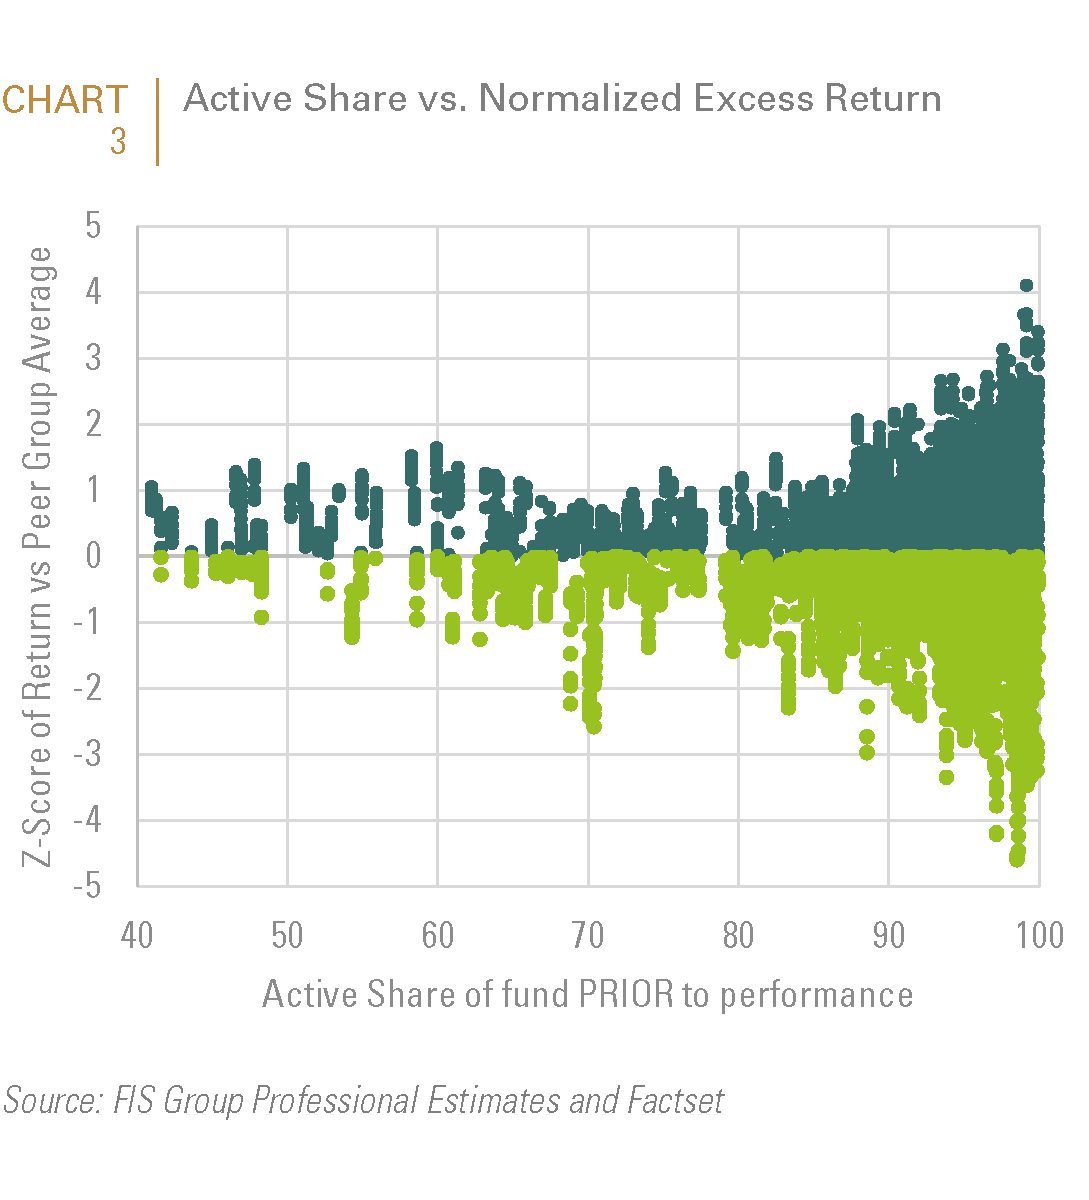
Another example of a statistic which is too often simplistically equated with manager skill is Active Share. Active Share is a relatively recent quantitative innovation popularized by Petajisto and Cremers which identifies managers that are meaningfully different than their index. A high Active Share score implies that a manager invests outside the index while a low score implies that the manager may invest very similarly to the index. While a high Active Share is necessary to significantly outperform an index, it is not, by itself, predictive of outperformance. As shown on Chart 3, a high Active Share is most likely to predict either top or bottom performing managers. So while Active Share can be used as a method of eliminating index huggers from an investable universe, if used in isolation it is not a good tool for choosing managers.
We are highlighting these examples to make two main points. First, that many of the statistics gathered on managers, while useful in judging a manager’s performance, are not predictive of future performance. Second, while no one can perfectly predict the future, a statistical measure’s ability to predict future performance can be back tested. In fact, predictability is the basis for any quantitative process and testing is the only way in which a process can have a rational basis.
Over the last 5 years, we have invested heavily to refine our quantitative process and have researched the predictive value of many statistics. As a result of this effort, we believe that we have uncovered a more predictive quantitative screening method which is currently being implemented into our manager selection processes. In the coming months, we plan to publish a paper that more fully explains our research findings, but in the interim, we thought this would be a good opportunity to highlight some key aspects of our research findings.
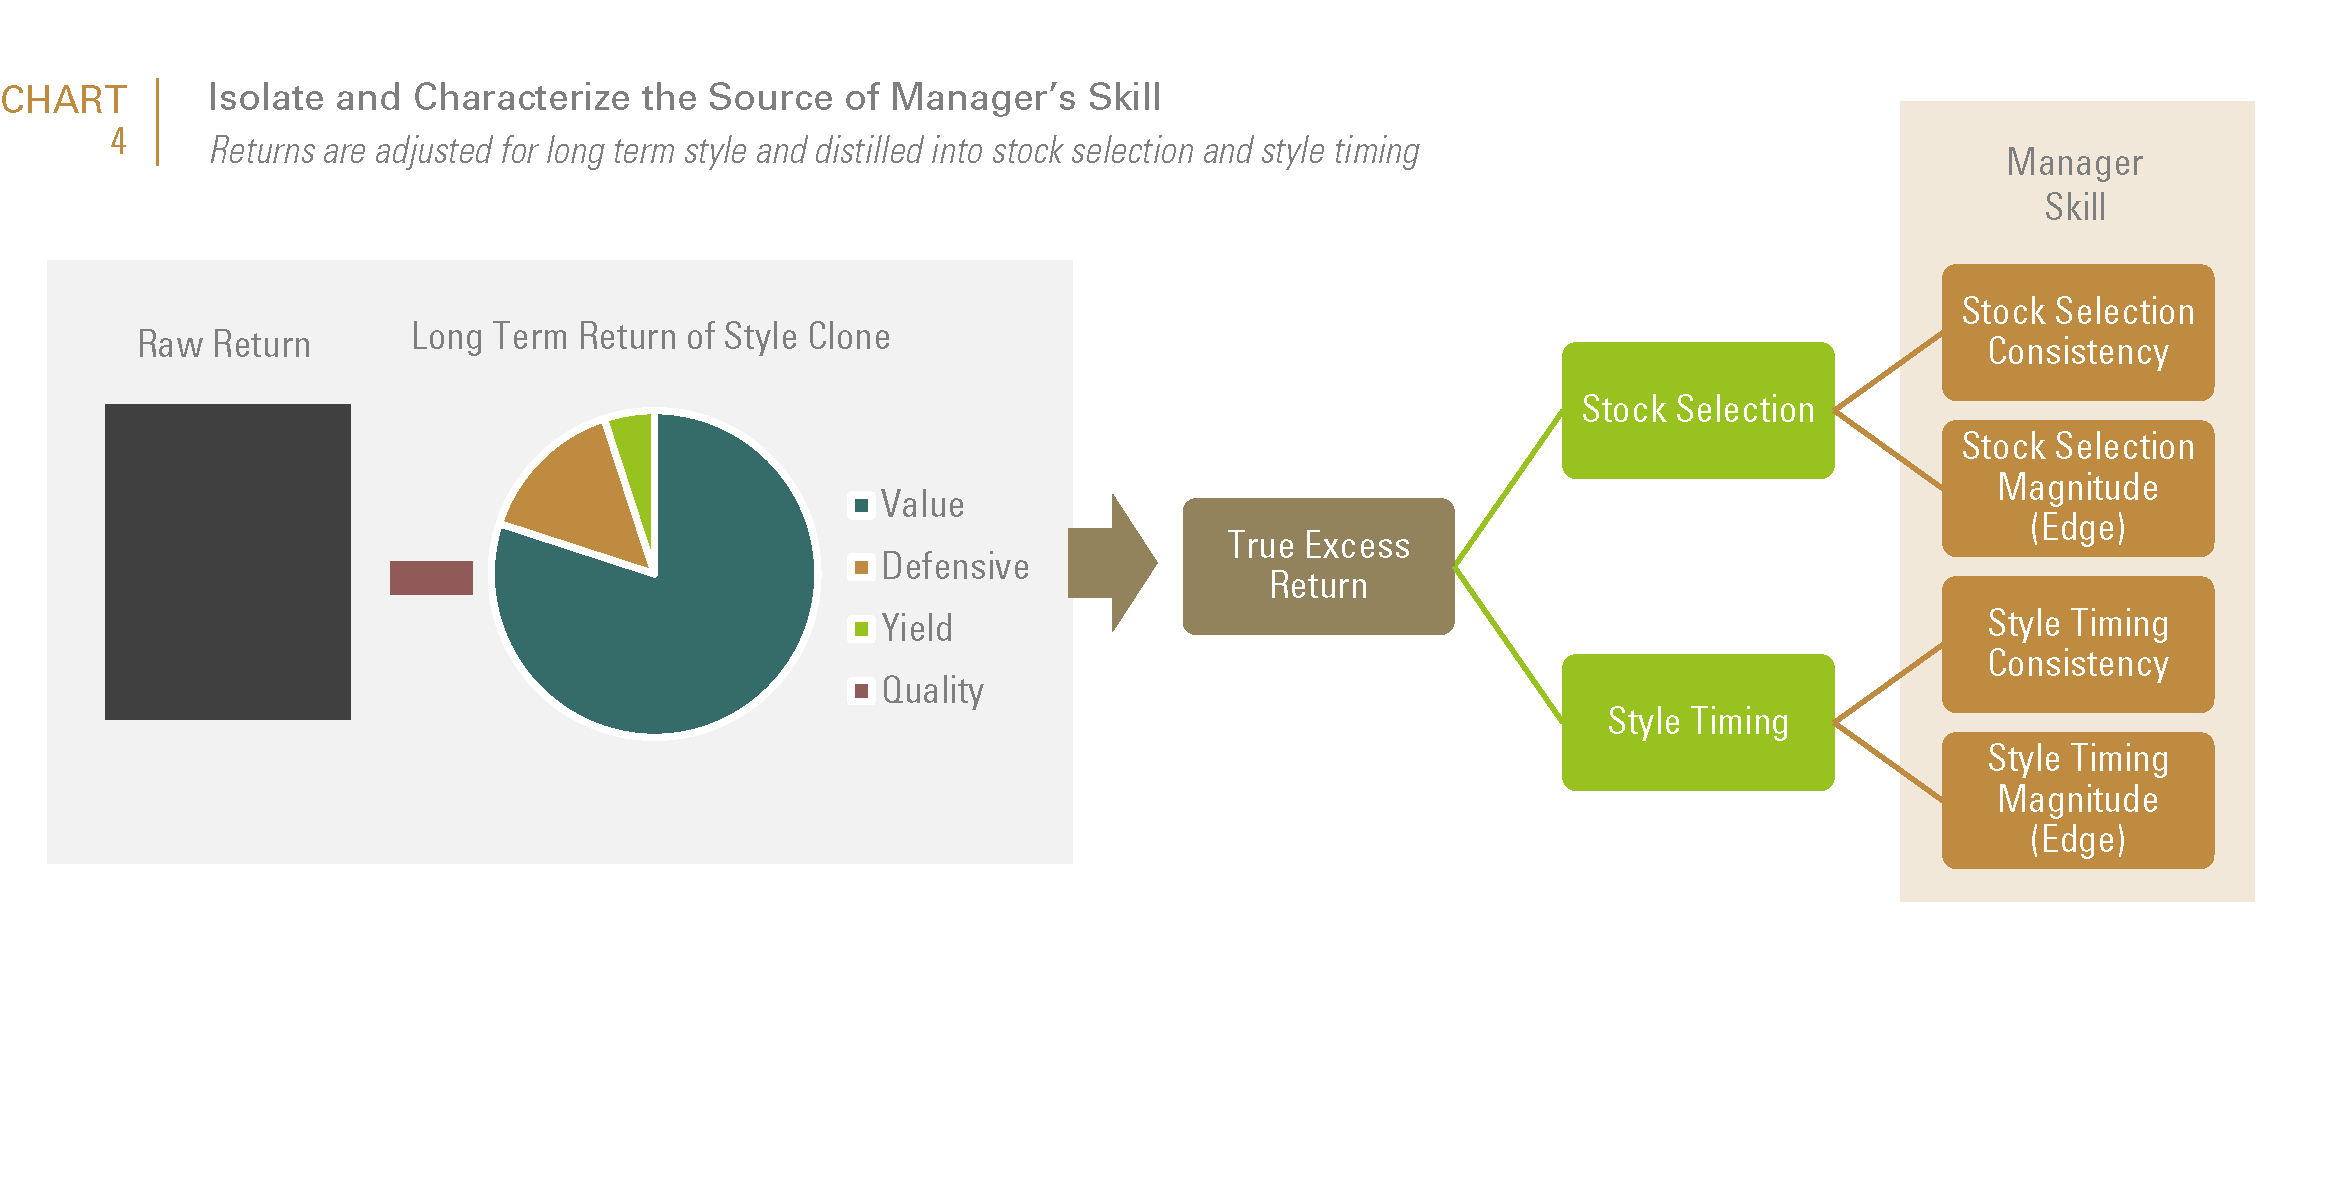
Chart 4 provides a pictorial overview of the resultant methodology. Our goal is to identify managers that are most likely to provide true excess return in the future. To do so, we systematically create a “clone” portfolio which is most representative of a manager’s style, and dissect the resulting excess return (manager’s return less the clone portfolio return) into components to better understand the drivers of performance. We also analyze the manager’s return texture by measuring the consistency and magnitude of excess return with respect to both stock selection and style (or factor) timing. It is only through the quantitative sifting afforded by this process, that concepts such as Active Share (though our methodology substitutes Active Share with a proprietary adaptation called the Active Opportunity Score, which helps correct for the benchmark specification and cyclicality challenges of Active Share) become useful for predictive performance forecasting. Simply put, the degree to which a manager makes active bets is necessary for outperformance; but is only valuable as a predictor of skill when combined with our process of systematically extracting “true” alpha and characterizing it’s sources and dimensions.
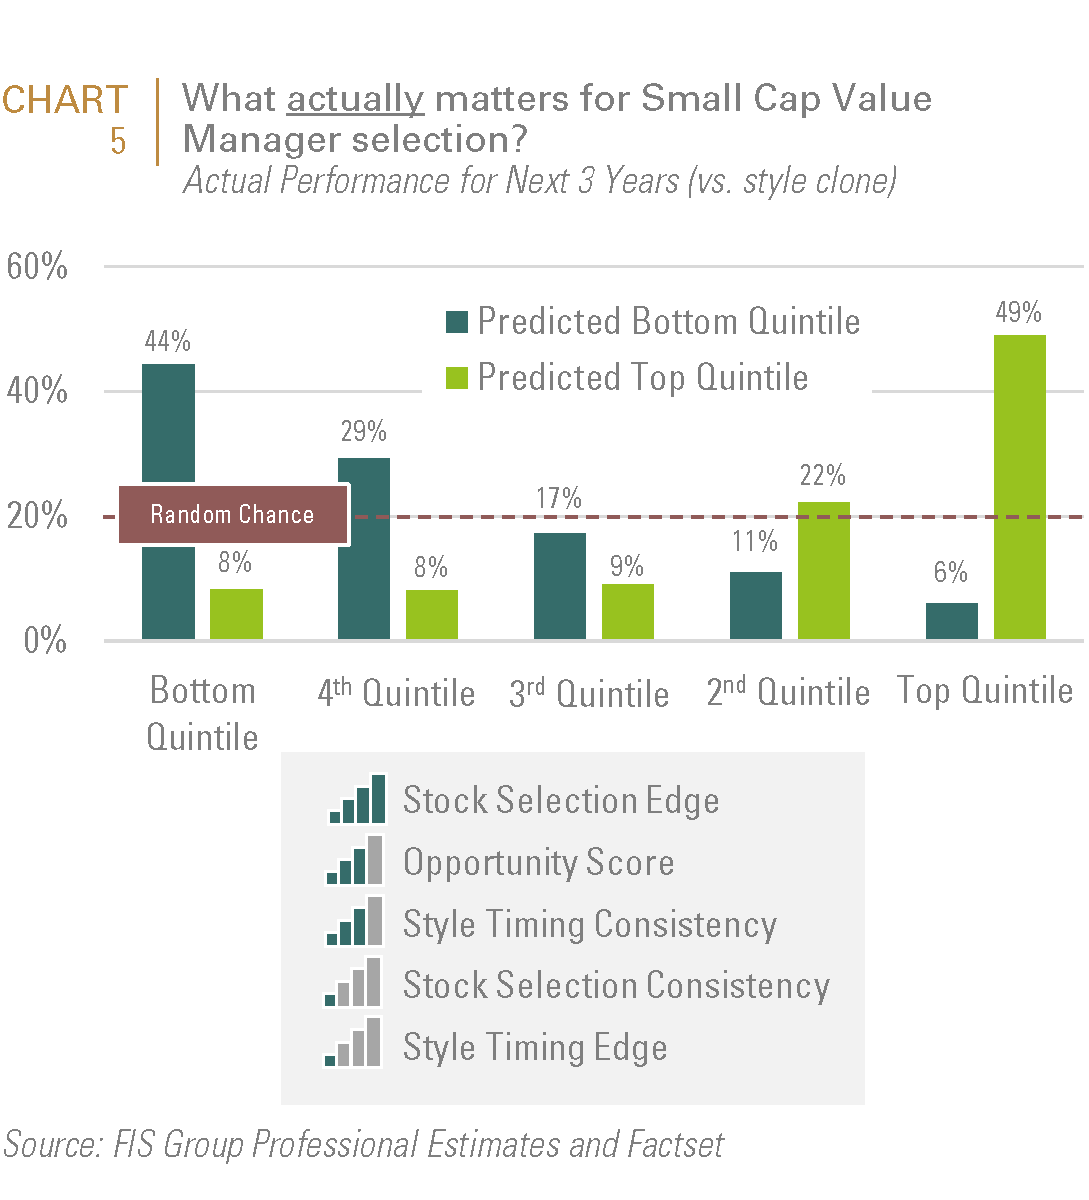
This may sound complicated, but as can be seen on Chart 5, the process allows us to substantially exceed the results that one would expect from a random or less predictive process. To explain, one would expect that a manager performance forecasting exercise which is devoid of skill to, over time, result in around 20% of the managers’ actual performance to fall into each of the 5 quintiles (which is indicated by the dashed red line). Using our process, close to 50% of the managers that ranked in the top (or 1st) quintile over the subsequent 3 years were forecasted to do so; and 71% of the managers who were forecasted to be top quintile performers actually ranked in the top two quintiles (i.e., the 1st and 2nd quintiles). Equally importantly, 44% of those that fell into the bottom (or 5th) quintile over the subsequent 3 years were forecasted to do so; and 73% of the managers that were forecasted to be bottom quintile performers subsequently fell into the bottom 2 quintiles (i.e., the 4th and 5th quintiles).
These results represent a dramatic improvement over commonly used screening criteria such as Information Ratio and Morningstar Rankings. Again, we recognize that selecting a manager should also involve intensive organizational and portfolio analysis. But qualitative due diligence is by definition, time consuming and can be expensive. Therefore, it is critical to utilize a front-end quantitative screening process that efficiently identifies a sub-set of managers which has a higher probability of relative outperformance and weeds out the managers who appear to be skilled but are really benefiting from style effects or luck.
This report is neither an offer to sell nor a solicitation to invest in any product offered by FIS Group, Inc. and should not be considered as investment advice. This report was prepared for clients and prospective clients of FIS Group and is intended to be used solely by such clients and prospects for educational and illustrative purposes. The information contained herein is proprietary to FIS Group and may not be duplicated or used for any purpose other than the educational purpose for which it has been provided. Any unauthorized use, duplication or disclosure of this report is strictly prohibited.
This report is based on information believed to be correct, but is subject to revision. Although the information provided herein has been obtained from sources which FIS Group believes to be reliable, FIS Group does not guarantee its accuracy, and such information may be incomplete or condensed. Additional information is available from FIS Group upon request.
All performance and other projections are historical and do not guarantee future performance. No assurance can be given that any particular investment objective or strategy will be achieved at a given time and actual investment results may vary over any given time.