
Over the past decade, our research has taken multiple in-depth looks at the exogenous drivers of what we think of as “alpha availability” among active managers. Our original work focused on smaller AUM managers’ ability to deliver relatively higher levels of alpha in various market environments (“Survival of the Nimble”). In early 2013 we expanded our analysis to identify active manager alpha drivers across markets and through time (“Is Active Equity Management Alpha on Permanent or Temporary Disability”). Building on our prior work, this study looks more in-depth at the concept of alpha availability (Part 1). We analyze the drivers of alpha availability with advanced techniques and higher resolution data (Part 2). Finally, we take a top-down look at the differences in quantitative managers’ return pattern vs. their fundamental peers (Part 3), which our colleagues wrote about earlier this year (“A Challenging Environment for Quant Strategies”).
Note to reader: Our use of the term “manager” represents the collective investment decision-making mechanisms of an investment strategy or portfolio. It includes the investment staff, systems, and quantitative models employed.
Key Takeaways from This Analysis:
- High Active share is a necessary, but not sufficient condition for high levels of excess return. Active share magnifies the skill (or lack thereof) of the manager. The availability of alpha due to market conditions will have the largest impact on highly active managers.
- The ideal market for active managers isn’t simply a bear market. In developed markets, active strategies perform best when there is concentrated weakness in benchmarks (a heavily weighted concentration in stocks lagging the index). This is almost always true in bear markets, but it is also common in the early cycle market rebounds.
- Periods of large, concentrated benchmark weakness are infrequent and difficult to predict. More actionable factors that coincide with high levels of alpha availability are a low to moderate liquidity environment, moderate levels of factor skew, low correlations amongst stocks and well-defined expectations for economic policy.
- The drivers of alpha availability are unique to the markets they operate in as well as the investment approach. There are distinct factors which benefit quantitative managers over fundamental managers and vice versa.
Part 1
Defining Alpha Availability
Robust analysis of manager skill contextualizes sources of return beyond the excess relative to a benchmark. The portion of return caused by the manager’s immutable style being in favor is not a reflection of skill. For example, in 2020 the EAFE Growth ETF (EFG) returned 17.98% vs. the EAFE Core ETF (EFA) return of 7.92%. This 10% return differential is correctly assigned to factor returns or style, not the skill of the EFG portfolio manager (they are just tracking the index); the same style adjustment needs to be made for active managers with stable factor exposures.1 The returns resulting from active portfolio decisions beyond a passive style (both security selection and shifts in style) are the best starting point to assess how much value a manager is adding or detracting. The size of the active bets (high active share, large sector/ region/ style overweights) will determine the magnitude of impact of each active decision. The final component and the focus of this study is assessing how the macro-economic and market environment impact the level and breadth of active returns. Are there periods where active risk-taking is more readily rewarded by the market, hence alpha is more available? If so, can we understand the drivers of this high alpha availability?
Alpha availability is the idea that the macro environment and market dynamics will impact active managers’ ability to beat their benchmark and style. Alpha availability is analogous to adding context before judging the time of a car trip. Living in the Philadelphia area, we are veterans of weekend trips to New Jersey beaches. Three hours is twice the time you will need to return to the city from the beach today (it is currently 25 degrees in March). That three-hour drive time is purely aspirational on a rainy Sunday in August.
If the concept of alpha availability is worth studying, we should see the following patterns in the universe of active managers.
- There will be periods when an abnormally large % of active managers generate or fail to generate alpha.
- During favorable periods, the most highly active managers should see their excess returns magnified, with the inverse being true during unfavorable periods.
Question 1: Is Active Manager Performance Driven by Systematic or Individual Dynamics?
To test this hypothesis, we examine two universes of active managers. If manager returns were solely dependent on individual risk-taking, we would expect the number of managers that exceed the benchmark to be consistently around 50% through time (gross of fees). Chart 1 is a simple visual test to see how likely the observed universe performance is from independent manager decisions or some common systematic component.
Each charts’ gold line represents the 99th percentile threshold for the peer group “win rate” if alpha were independent across managers and through time. Win rate is the percentage of products outperforming their best fitting benchmark2 for the trailing 12-month period. We calculate the threshold using a cumulative Binomial distribution with the numbers of products in the universe as the number of Bernoulli trials and a 50% probability of success. If manager returns are independent of one another, we expect to see the blue line below the orange line 99% of the time.
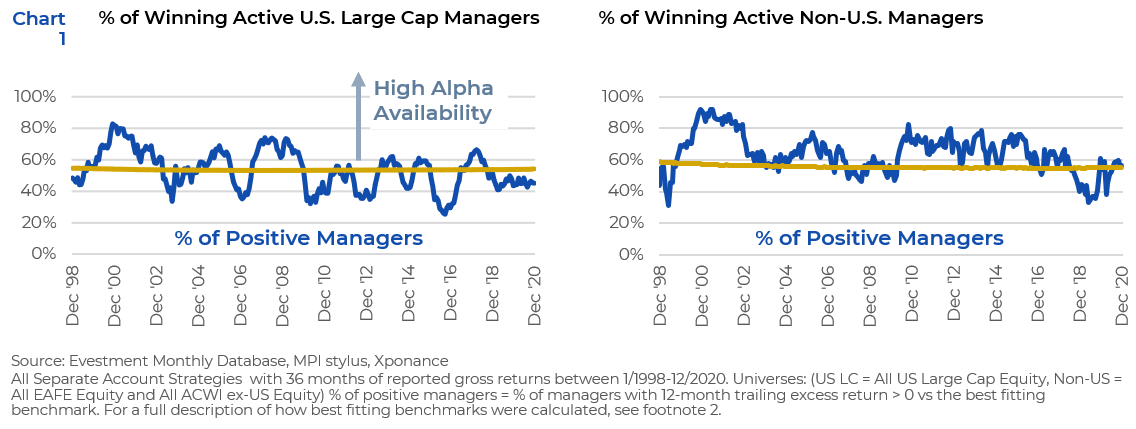
The threshold for independence was exceeded in Domestic and Non-US universes for most of the periods analyzed. The clustering of positive and negative excess returns through time implies a systematic element impacting each manager’s ability to generate alpha. Experience tells us that crowding in positions, factors, and approaches play a significant role in this phenomenon. However, the persistence seen across strategies, styles, and market geographies suggests that alpha availability is not only a result of crowding but a systematic element.
Question 2: Is Risk-Taking Rewarded during “successful periods” and Penalized during “unsuccessful” periods?
If alpha availability is a systematic phenomenon (driven by external factors), we would expect the periods in which a large percentage of active managers do well to disproportionately favor those with the most active risk. Using our drive time example, a favorable period for alpha availability is equivalent to removing traffic and speed limits from our car trip. All cars will see their trip time decrease, but we would expect the most aggressive drivers in the fastest cars to benefit the most. To identify the managers with the highest levels of active risk for analysis, we revisit active share.
Our 2013 study highlighted that difference from the benchmark is not necessarily an indicator of skill. We stated, “If a manager possesses persistent skill, greater variation from the benchmark (i.e., higher Active Share), would be expected to amplify their return relative to their style peers who are equally skillful but exhibit little deviation from the holdings of the benchmark over time.” We also noted the weak but positive correlation between active share and positive excess returns for non-U.S. equity managers and a negative correlation for U.S. equity managers. It was this latter observation which led to that paper’s exploration of exogenous systematic factors that impact the availability of alpha for large cap core managers.
Updating our analysis with newer data and more thoroughly correcting for survivorship and selection bias, we have updated our perspective on active share’s role in our manager skill assessment.3 Our primary adjustment was to focus on a larger number of shorter horizon returns (1 year rather than 5-10 year). Long-term return calculations coupled with the dynamics of the active share statistic introduce survivorship and selection bias. Long-run returns rely inherently on survival rates, biasing returns upwards. High active share managers have higher tracking error on average. If you only examine managers with high active share, your odds of observing a successful manager will increase the longer you make your return measurement window. Unsuccessful (and highly active) managers are more likely to close for performance reasons before the full horizon is reached. The requirement of a long-term horizon leads to a selection bias of higher observed returns, likely explaining the positive relationship between the variables.
Chart 2 shows that high active share remains a strong indicator of risk-taking. The higher the active share of a manager, the wider the range of outcomes for excess return. There is no significant positive relationship observed between active share and alpha. High active share is a necessary, but not sufficient condition of outsized excess returns.
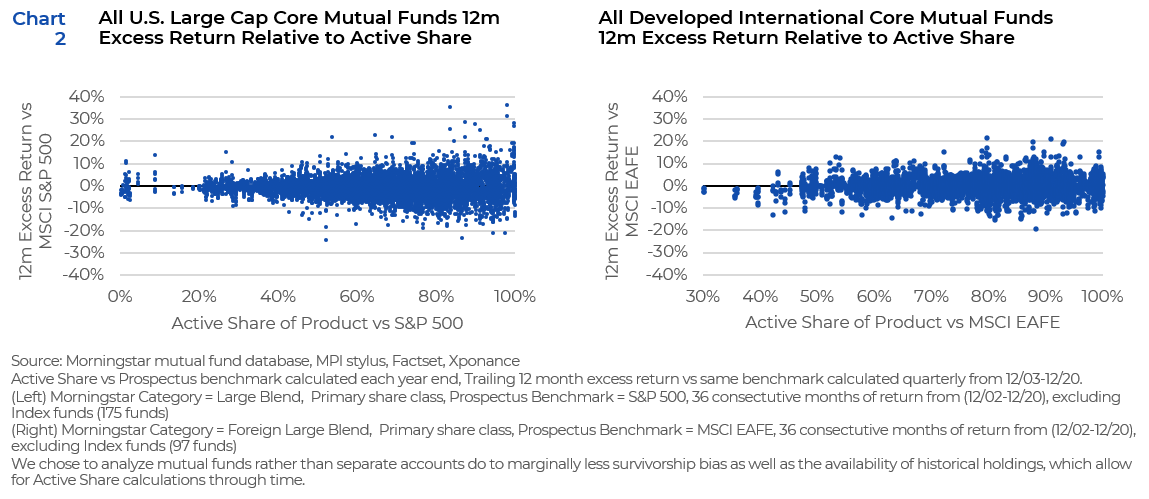
High active share remains a good proxy for risk-taking. This allows us to consider the second prerequisite question. Does high active share lead to higher excess returns during favorable periods for active managers, and vice versa?
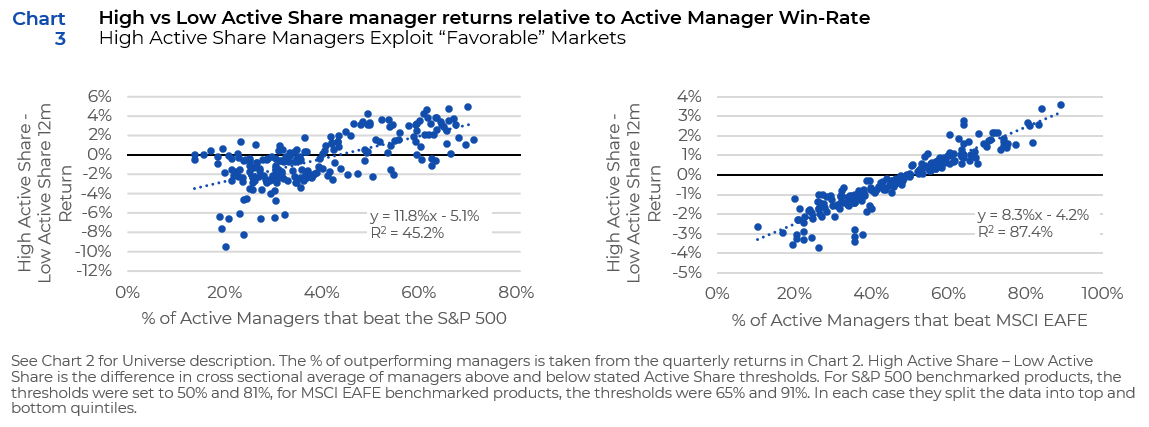
There is a strong relationship between the % of managers who beat the benchmark and the differential between high vs low active share managers (Chart 3). During high alpha availability periods, investing in high active share managers is highly likely to have a favorable outcome. The inverse is true during low alpha availability periods when allocators would be better off focusing on strategies with tighter benchmark constraints and index funds.
Allocators are adept at allocating based on geography, market cap and style. Alpha availability implies an additional dimension to consider, a strategy’s risk posture (Full Index replication through 100% active share). Understanding the environmental drivers will allow allocators to make more informed decisions about the risk posture of their manager selections. We determine what systematic factors contribute high and low alpha availability in Part 2 of our study.
1 https://www.aapryl.com/wp-content/uploads/2020/08/Equity-Efficacy.pdf
2 Best fit benchmarks were selected for each product from the following list based on maximum R-Squared to the product: US LC: S&P 500 (Core, Value, Growth), Russell 1000 (Core, Value, Growth), Russell 2500 (Core, Value Growth). Non-US: MSCI EAFE (Core, Value, Growth), MSCI ACWIxUS (Core, Value, Growth). EM (MSCI EM (Core, Value, Growth). All indices are Net Returns in US Dollars. R-Squared is calculated for the entire common history of the product and benchmarks using monthly data.
3 To more thoroughly correct for survivorship bias, we used the Morningstar historical Mutual Fund database including closed funds. We shrunk the investment horizon to 12m to further eliminate the impact of survivorship. In isolation a 12m horizon is a poor indication of manager skill, but the collective analysis of all 12m horizons across all products will allow any inherent pattern to emerge.
This report is neither an offer to sell nor a solicitation to invest in any product offered by Xponance® and should not be considered as investment advice. This report was prepared for clients and prospective clients of Xponance® and is intended to be used solely by such clients and prospects for educational and illustrative purposes. The information contained herein is proprietary to Xponance® and may not be duplicated or used for any purpose other than the educational purpose for which it has been provided. Any unauthorized use, duplication or disclosure of this report is strictly prohibited.
This report is based on information believed to be correct, but is subject to revision. Although the information provided herein has been obtained from sources which Xponance® believes to be reliable, Xponance® does not guarantee its accuracy, and such information may be incomplete or condensed. Additional information is available from Xponance® upon request. All performance and other projections are historical and do not guarantee future performance. No assurance can be given that any particular investment objective or strategy will be achieved at a given time and actual investment results may vary over any given time.