
Executive Summary
Climate-aligned equity indices have faced a challenging start to 2026. To better understand the drivers of this divergence, we analyzed the performance of the MSCI USA Climate Paris-Aligned Benchmark (PAB) Index relative to its parent MSCI USA Index across sector, style, emissions, and asset-intensity dimensions.
Through the end of February, the MSCI USA Climate Paris-Aligned Benchmark (PAB) Index underperformed its parent MSCI USA Index by 4.68% year-to-date (-4.28% vs +0.40%). While the period is short, the magnitude of divergence warrants examination.
The underperformance reflects more than a rally in higher-emitting sectors. Attribution analysis indicates that both structural underweights to capital-intensive industries and stock-level repricing within large-cap growth were meaningful contributors. Across sector, style, emissions, and asset-intensity lenses, a consistent pattern emerges: the market has rewarded tangible asset exposure while reassessing long-term margin durability and competitive positioning in asset-light, intangible-heavy businesses—particularly within software and large-cap growth—amid heightened scrutiny of AI-driven disruption and rising capital expenditure intensity.
Although two months of performance do not establish a structural regime shift, the episode highlights how climate-aligned indices, which often tilt toward lower-emission and asset-light companies, may be indirectly exposed to evolving assumptions about business resilience.
Background and Context
The MSCI USA Climate Paris-Aligned Benchmark (PAB) Index is a decarbonized version of the MSCI USA Index designed to align with the Paris Agreement by reducing carbon intensity and applying fossil fuel revenue screens while maintaining broad market exposure.
While the index has a longer back tested history, its live performance record began in October 2020. As a result, tracking error and relative return behavior have occurred largely during a period characterized by strong growth and technology leadership. Historical comparisons are therefore based on a relatively short live sample and may not fully capture behavior across different leadership regimes.
From Asset-Light Advantage to Competitive Reassessment
For much of the past decade, lower-emission exposure often overlapped with asset-light, scalable business models—particularly in software, digital platforms, and certain services industries. These companies were widely viewed as possessing durable competitive advantages supported by high switching costs, network effects, and strong incremental margins.
In that environment, asset-light was often synonymous with resilience.
The current episode suggests that assumption is being reassessed.
Rising AI investment has introduced two related pressures. First, increasing capital expenditure among large technology firms challenges the perception that leading platforms are structurally capital-light. Second, advances in generative AI have prompted debate about whether competitive differentiation in certain software categories may narrow, potentially compressing margins and reducing the durability of previously assumed advantages.
The repricing of parts of the large-cap growth universe—where climate-aligned indices often have meaningful exposure—has been a significant contributor to recent underperformance.
Sector Leadership and Capital Intensity
Sector attribution shows that relative performance has been concentrated in a limited number of areas (Table 1). Information Technology accounted for -2.23% of excess return, reflecting both overweight exposure and weaker stock selection. Industrials detracted -1.24%, primarily due to a structural underweight in a sector that rallied strongly. Energy and Consumer Staples also contributed negatively.
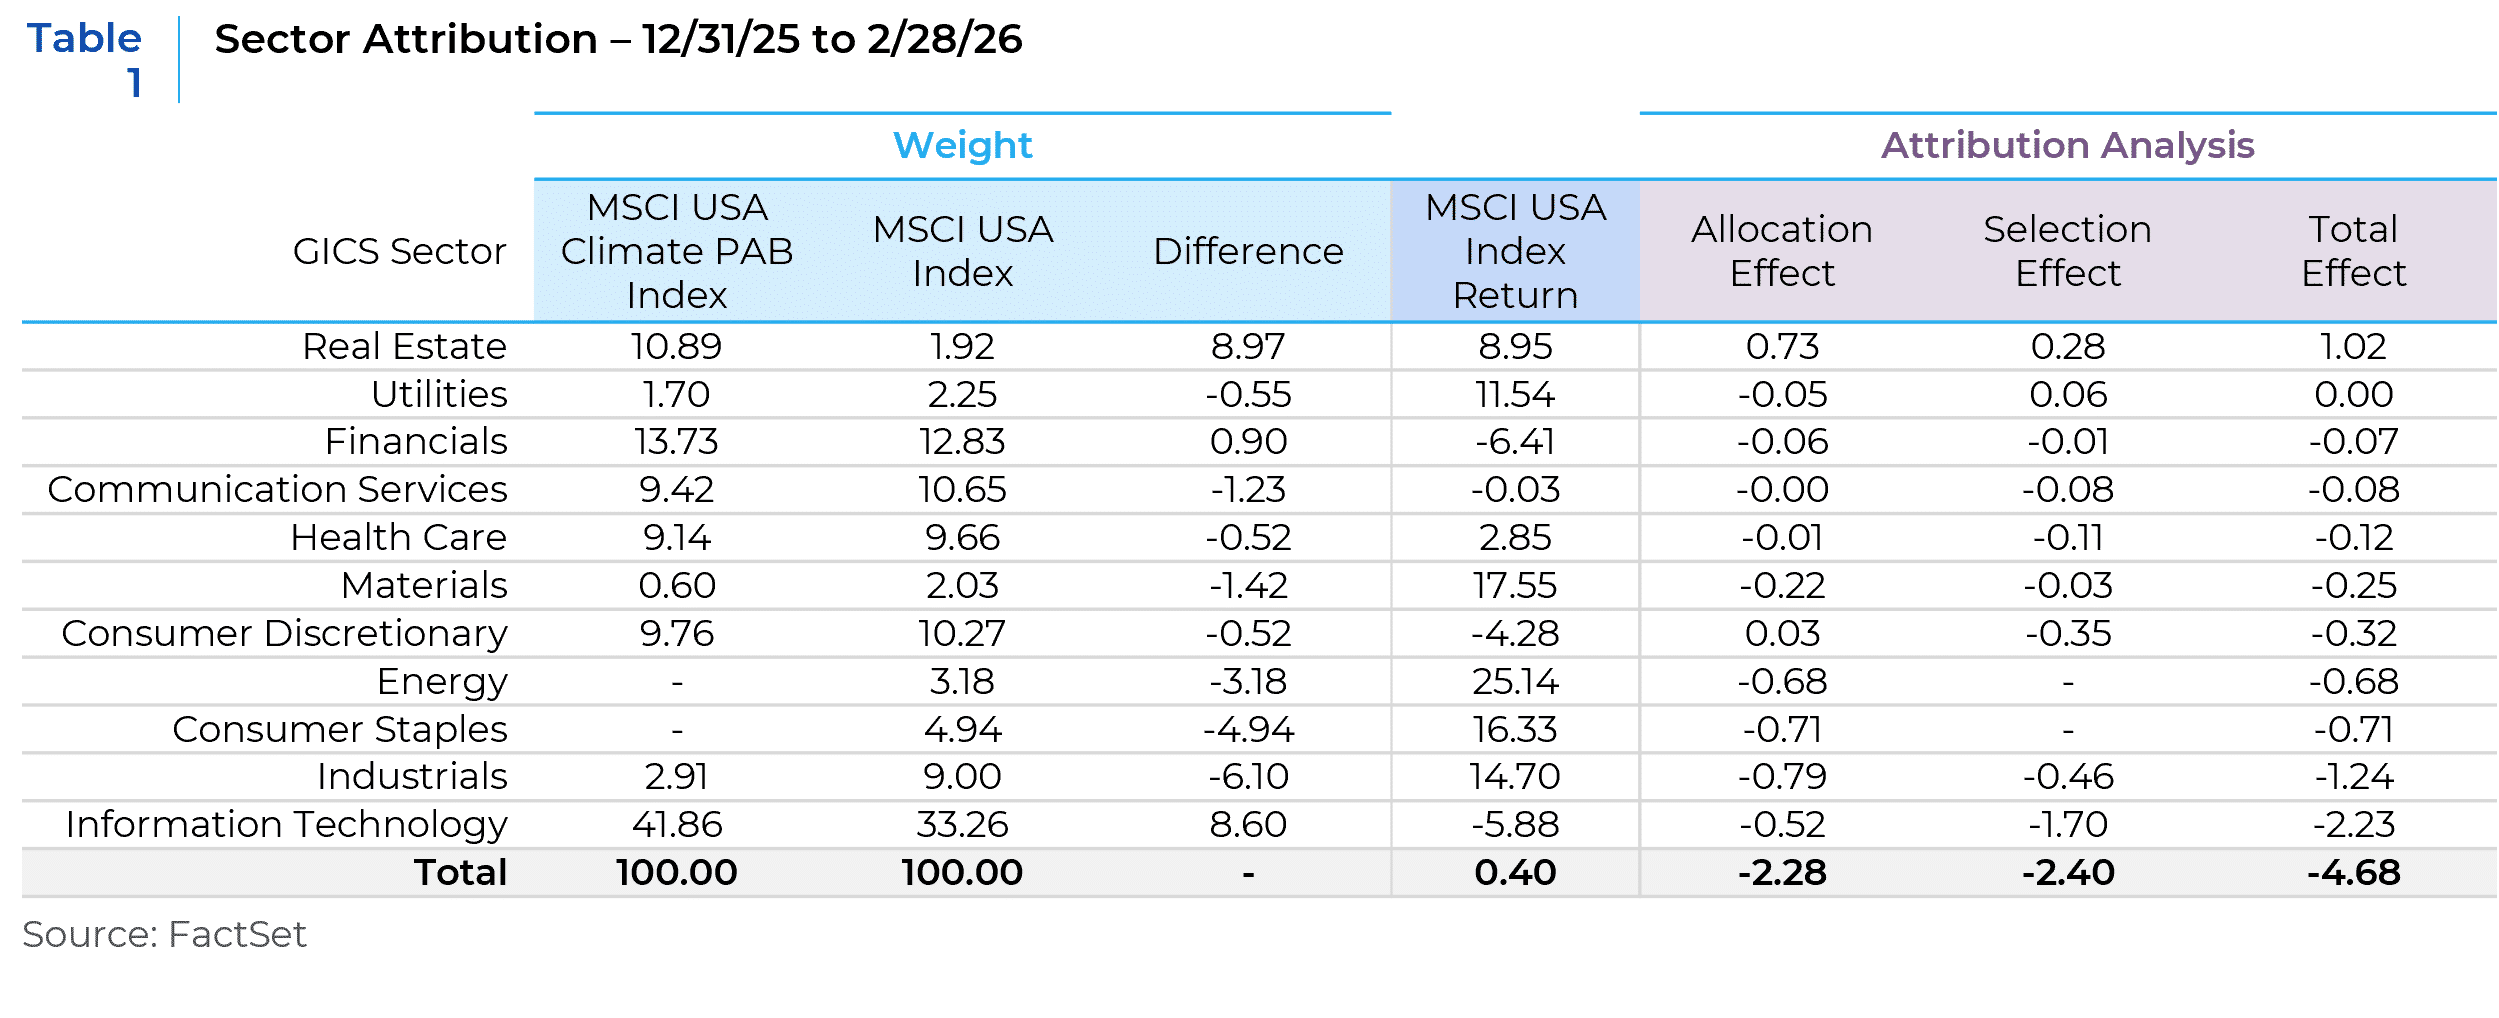
Elevated cross-sector dispersion during the period mechanically amplified the impact of these structural tilts. This dispersion has been unusually concentrated in a small number of sectors, increasing the sensitivity of structurally tilted indices to short-term rotations
Style Dynamics: Growth Repricing
Style attribution reinforces this interpretation (Table 2). Large Growth exposure detracted -1.79%, with both allocation and selection effects contributing. The underweight to Large Value detracted -1.01% as value-oriented, capital-intensive companies outperformed.
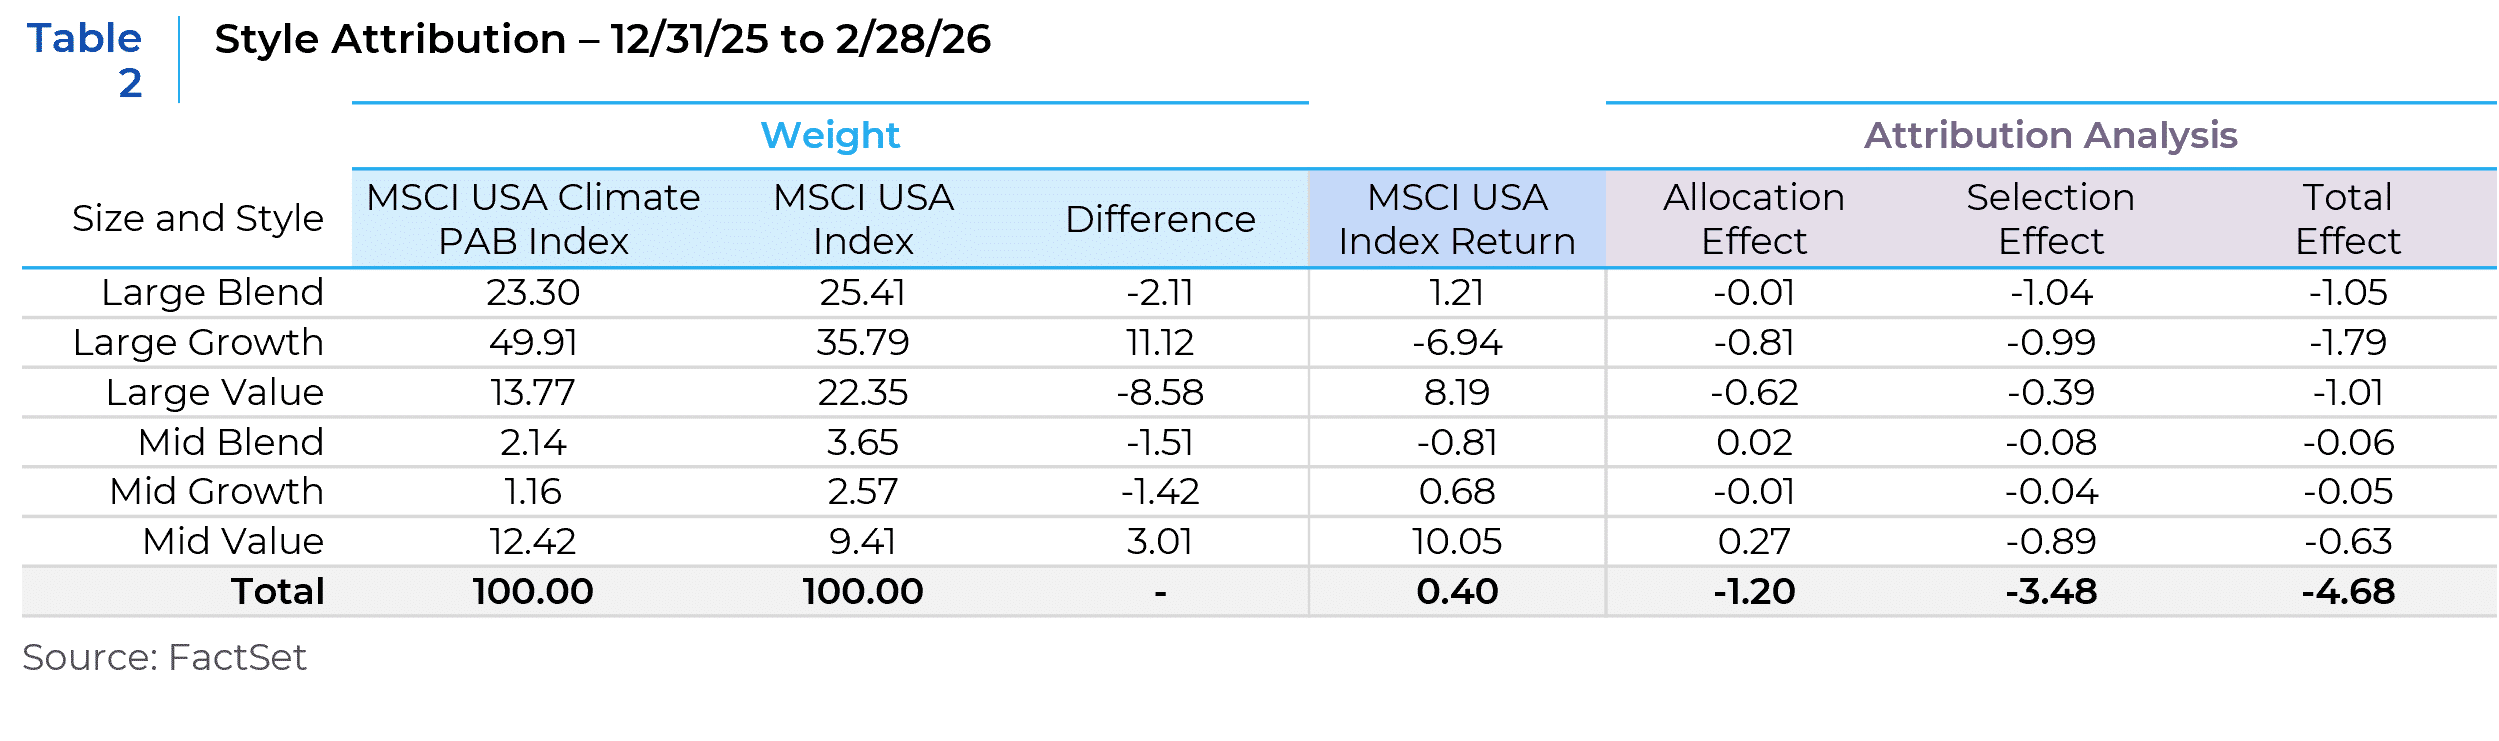
Most of the style-related shortfall arose from selection rather than allocation, suggesting dispersion within growth segments particularly among AI-exposed companies has been a defining feature of the period.
Emissions and Business Model Overlap
Emissions analysis provides additional insight (Table 3). Within the MSCI USA benchmark, the lowest-emitting quintile declined 15.08% year-to-date, materially underperforming the broad index, while higher-emitting quintiles posted positive returns.
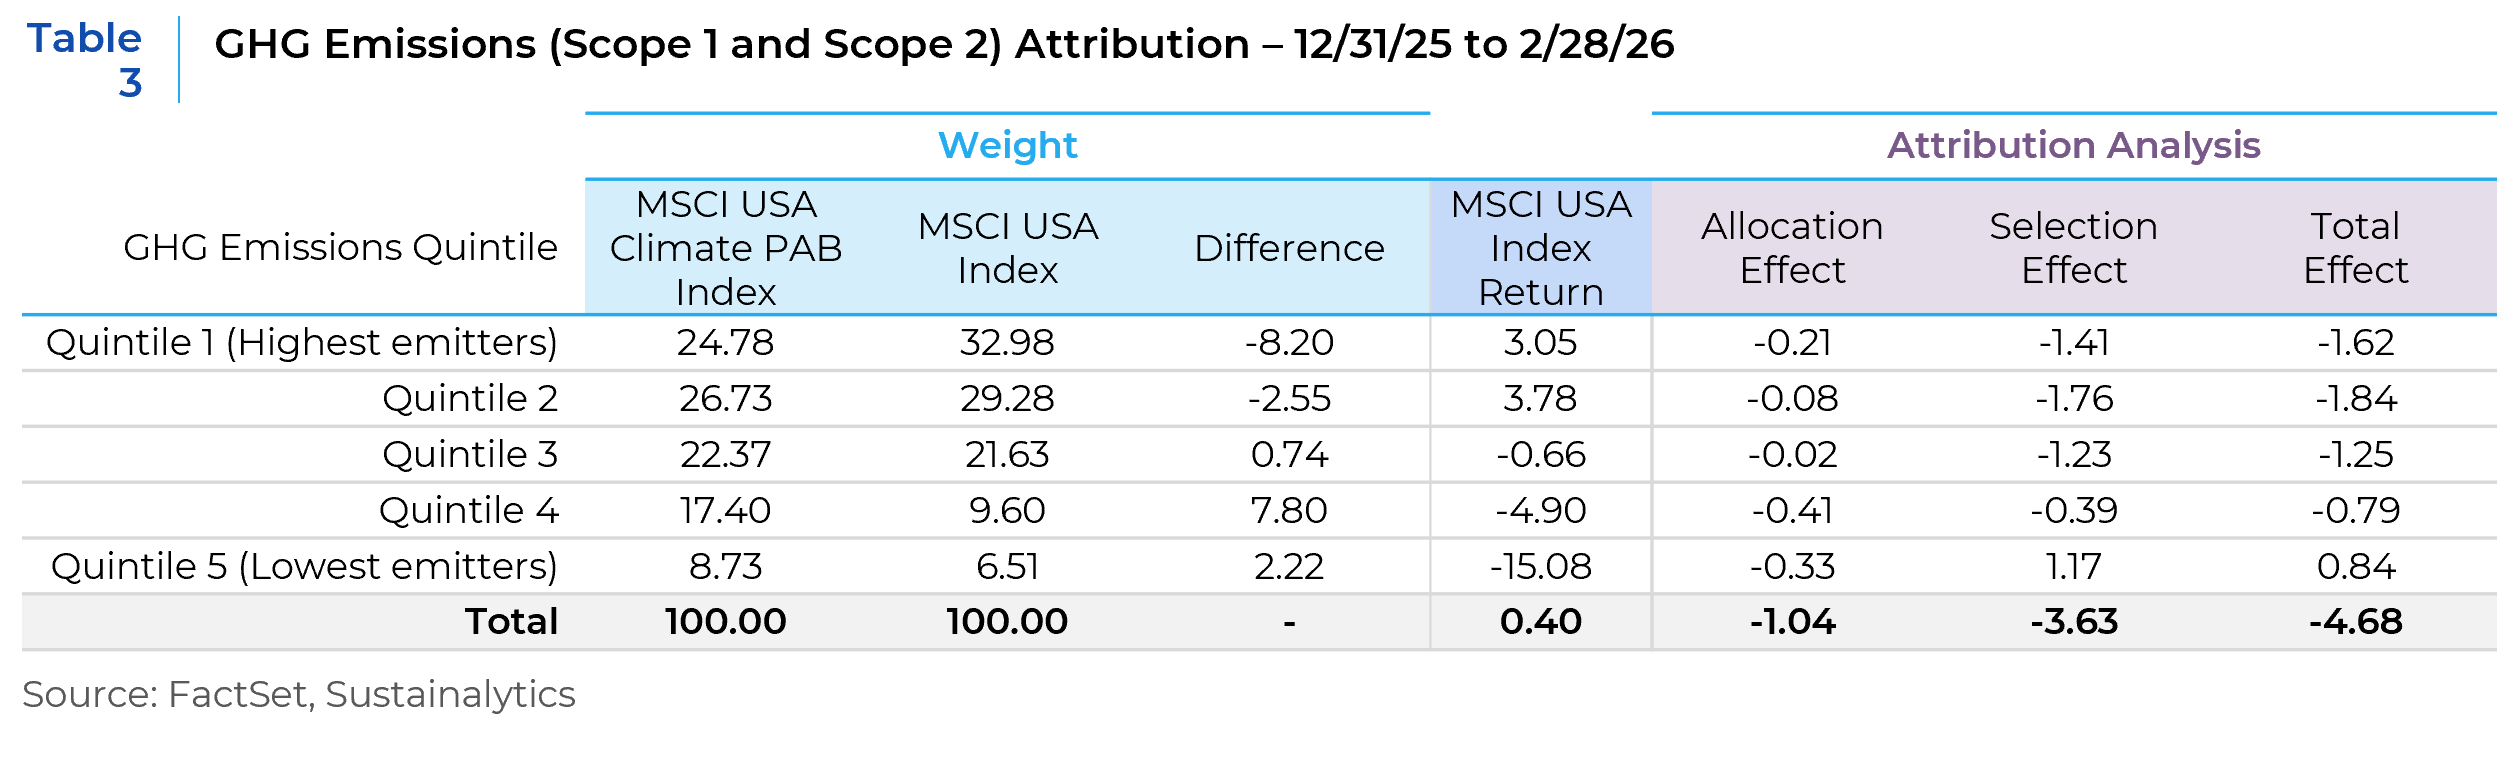
Structural underweights to higher-emitting companies contributed to relative underperformance. However, selection effects within multiple emissions quintiles were also significant. The majority of emissions-related underperformance reflects stock-level dispersion rather than carbon exposure alone.
Lower emissions often correlate with lower capital intensity and intangible-heavy business models, increasing sensitivity to the current repricing dynamic.
Asset Intensity as a Cross-Check
Asset intensity (PPE / Assets) provides a consistent signal (Table 4). Within the MSCI USA benchmark, the most asset-intensive quintile returned 7.09% year-to-date, while the least asset-intensive quintile declined 6.18%.
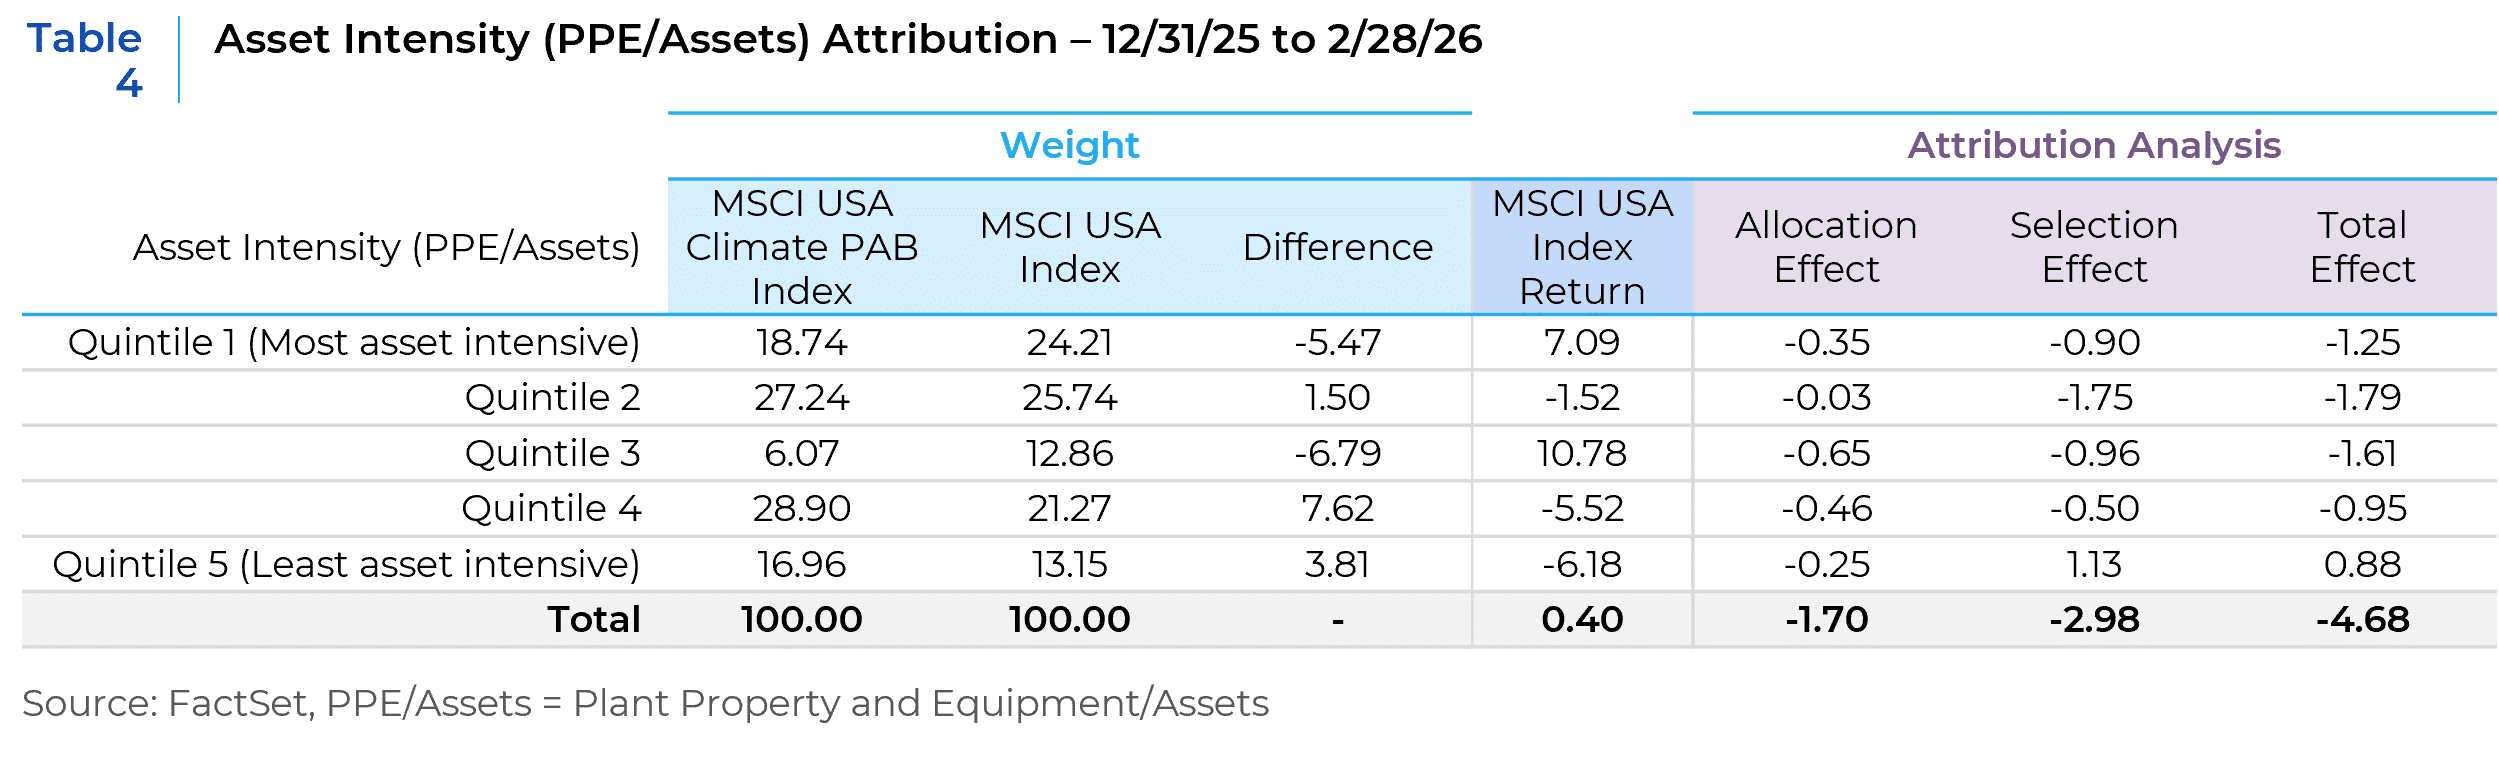
Across sector, style, emissions, and asset-intensity dimensions, a coherent pattern emerges: the market has rewarded tangible asset exposure while reassessing the long-term resilience of intangible-heavy models.
Tracking Error and Historical Context
The -4.68% excess return year-to-date prompts a practical question: is this unusual relative to a 2.5%–3% annualized tracking error expectation?
Tracking error represents an expected standard deviation of excess returns over a one-year horizon, not a cap on short-term outcomes. In periods of concentrated leadership and elevated dispersion, realized excess returns can exceed model-based expectations over shorter windows.
However, historical context is important. Since inception, the live history of the PAB index spans a period largely characterized by growth and technology dominance. Periods in which capital-intensive and value-oriented sectors led decisively are less represented in the live record.
To provide additional context, Chart 1 shows rolling three-month excess returns since its launch.

Rolling three-month excess returns have periodically approached ±2–4%, particularly during episodes of pronounced sector rotation. The current episode ranks among the weakest short-term observations in the live record but remains within the historical range of observed dispersion. The limited live history constrains longer-cycle comparisons.
From an investor’s perspective, the recent divergence appears large relative to the recent live experience. Whether it is statistically unusual over a full market cycle is more difficult to determine given the constrained live record.
Looking Ahead
The recent divergence does not establish a structural breakdown in climate-aligned investing. The period is short, and leadership can shift quickly.
However, it highlights how climate-aligned exposures behave when capital-intensive sectors outperform and growth-oriented business models are reassessed. If AI ultimately reinforces competitive advantages and productivity among leading platforms, current repricing may prove cyclical. Conversely, if competitive differentiation narrows and capital intensity rises structurally, valuation premia for some asset-light companies may remain under pressure.
Understanding how carbon intensity, capital intensity, and evolving competitive dynamics interact will be increasingly relevant in assessing both expected return and volatility for climate-oriented strategies.
This report is neither an offer to sell nor a solicitation to invest in any product offered by Xponance® and should not be considered as investment advice. This report was prepared for clients and prospective clients of Xponance® and is intended to be used solely by such clients and prospective clients for educational and illustrative purposes. The information contained herein is proprietary to Xponance® and may not be duplicated or used for any purpose other than the educational purpose for which it has been provided. Any unauthorized use, duplication or disclosure of this report is strictly prohibited.
This report is based on information believed to be correct but is subject to revision. Although the information provided herein has been obtained from sources which Xponance® believes to be reliable, Xponance® does not guarantee its accuracy, and such information may be incomplete or condensed. Additional information is available from Xponance® upon request. All performance and other projections are historical and do not guarantee future performance. No assurance can be given that any particular investment objective or strategy will be achieved at a given time and actual investment results may vary over any given time.