
It has been the best of times, it has been the worst of times…for growth and value…over the last decade.
Since the end of the Great Financial Crisis (GFC), economic and market conditions have been generally favorable for US growth stocks. The economy grew at a slow and steady pace, rates remained anchored near historic lows and inflation was benign. As a result, growth’s outperformance has been strong and especially pronounced in the last 12 to 18 months. However, conditions are gradually changing, and the extreme divergence in style performance may be waning. While it is impossible to predict the future, a look at the performance of the growth and value styles and the prevailing economic environment could offer valuable insights into what’s ahead. We delve into this issue in a 3-part post. Part 1 looks at the disparity between value and growth, Part 2 will examine the reasons behind it, and Part 3 will discuss why things could change.
Part 1: The Divergence between Value and Growth
Returns: The cumulative return spread between Value and Growth has been steadily widening since the GFC and was at an extreme as of August 31, 2019. The chart below (Figure 1) illustrates this using the S&P 500 Value and Growth indices. Comparing the S&P Pure Value and S&P Pure Growth Indices (Figure 2), which include only stocks that have either value or growth characteristics and are thus more style-focused, the spread is even more glaring. For interested readers, the differences between the style and pure style indices are provided in a table at the end. Figure 3 illustrates how growth has had an easier time outperforming value since for most of the period since 2007, with some short spurts of outperformance by value.
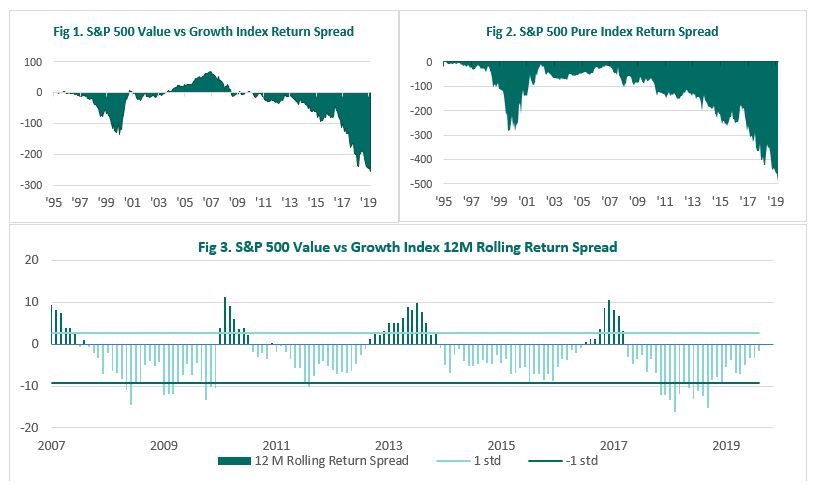
Source: Bloomberg, Piedmont Investment Advisors
Valuation: While Value has been underperforming Growth since 2007, the forward P/E ratios in the initial part of that time period suggested that Growth was relatively inexpensive. Now that Growth investments have appreciated so much more than Value, forward P/E ratios are starting to suggest that Growth investments are comparatively more expensive. The P/E of value stocks relative to Growth is now trading at its deepest discount since the dot-com bubble. Value stocks, especially in Small and Mid-Cap, are relatively inexpensive when comparing the current P/E to its 20-year average level. A short period of outperformance for Value P/E and P/CF emerged after the market peak in 2007, but ever since the downturn of 2009, the spread in multiples has continued to widen as the cycle progressed.
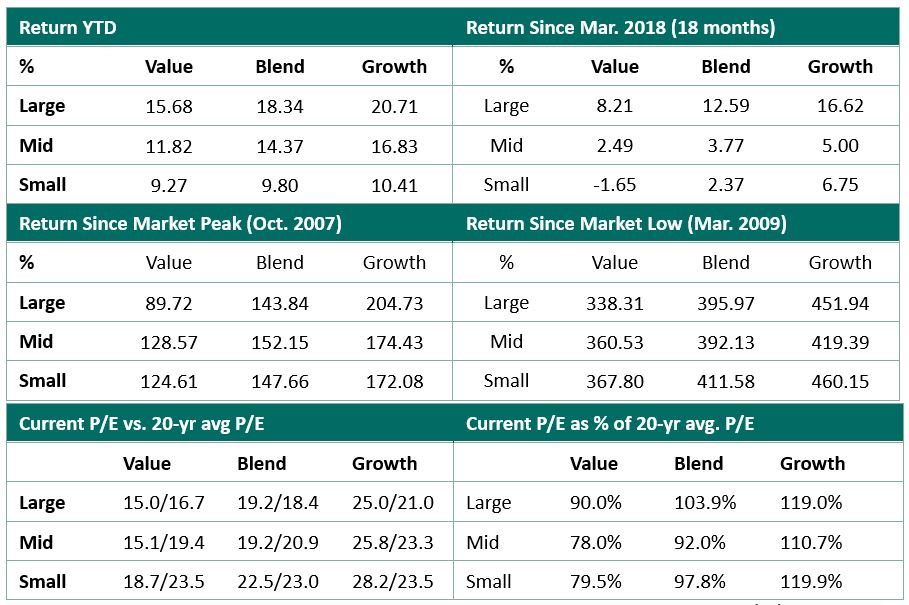
Source: J.P. Morgan, Bloomberg, Piedmont Investment Advisors. The data provided in the tables above are as of 8/31/19.
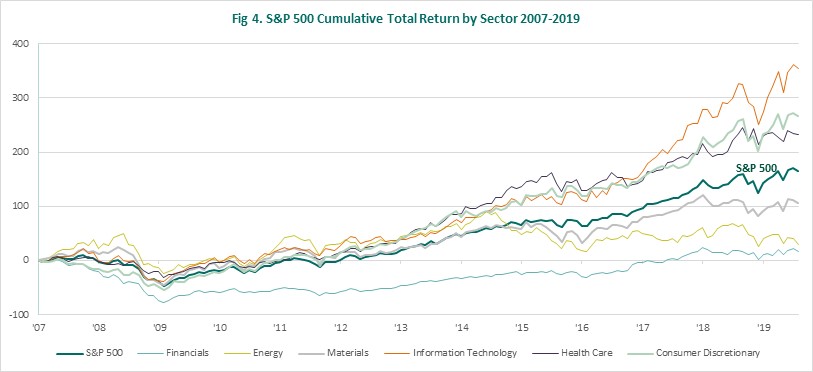
Sector Performance: The most heavily weighted sectors in the Value index – Financials, Energy, and Materials have struggled in the recent past (Figure 4). Financials have tumbled in the current low interest rate environment as a consequence of the flattening yield curve and weak revenue growth. Commodity-sensitive cyclicals, including Energy and Materials, have lagged as well. On the other hand, the Information Technology sector, with a 27% weight in the Growth Index, has been the market leading sector. Other growth sectors like Health Care and Consumer Discretionary have also done well in this period.
In our next post, we will explore the reasons behind Value’s underperformance relative to Growth.
Differences between Style Indices and Pure Style Indices
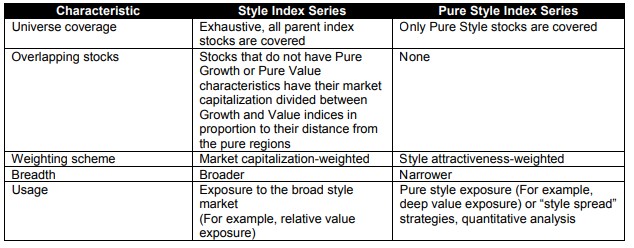
Source: S&P Dow Jones Indices: S&P U.S. Style Indices Methodology
Source Material providers for this post include Credit Suisse, Loomis Sayles, J.P. Morgan, and RBC Capital Markets