
2020 Outlook for Emerging and Frontier Markets: Text Version Only
While the U.S. continued its decade-long run, surging ahead another +31% in 2019 to lead all major developed markets (except Switzerland, +32.5%), three emerging markets did even better last year. Taiwan gained +36% as investors reevaluated the “moat” of its market champion, Taiwan Semiconductor (TSMC), amid a new outlook for Sino-American economic relations. Greece gained +43% off a very low base as the economy began to emerge from its decade-long slump from austerity. But it was Russia that led all developed or emerging markets with a whopping +51% surge in 2019. Quietly, the once pariah market of Russia has now not only outpaced all emerging markets over the past 5 years (+175% vs +46%), but has substantially outperformed even the consensus trade in U.S. equities over the same time period (+175% vs +74%).
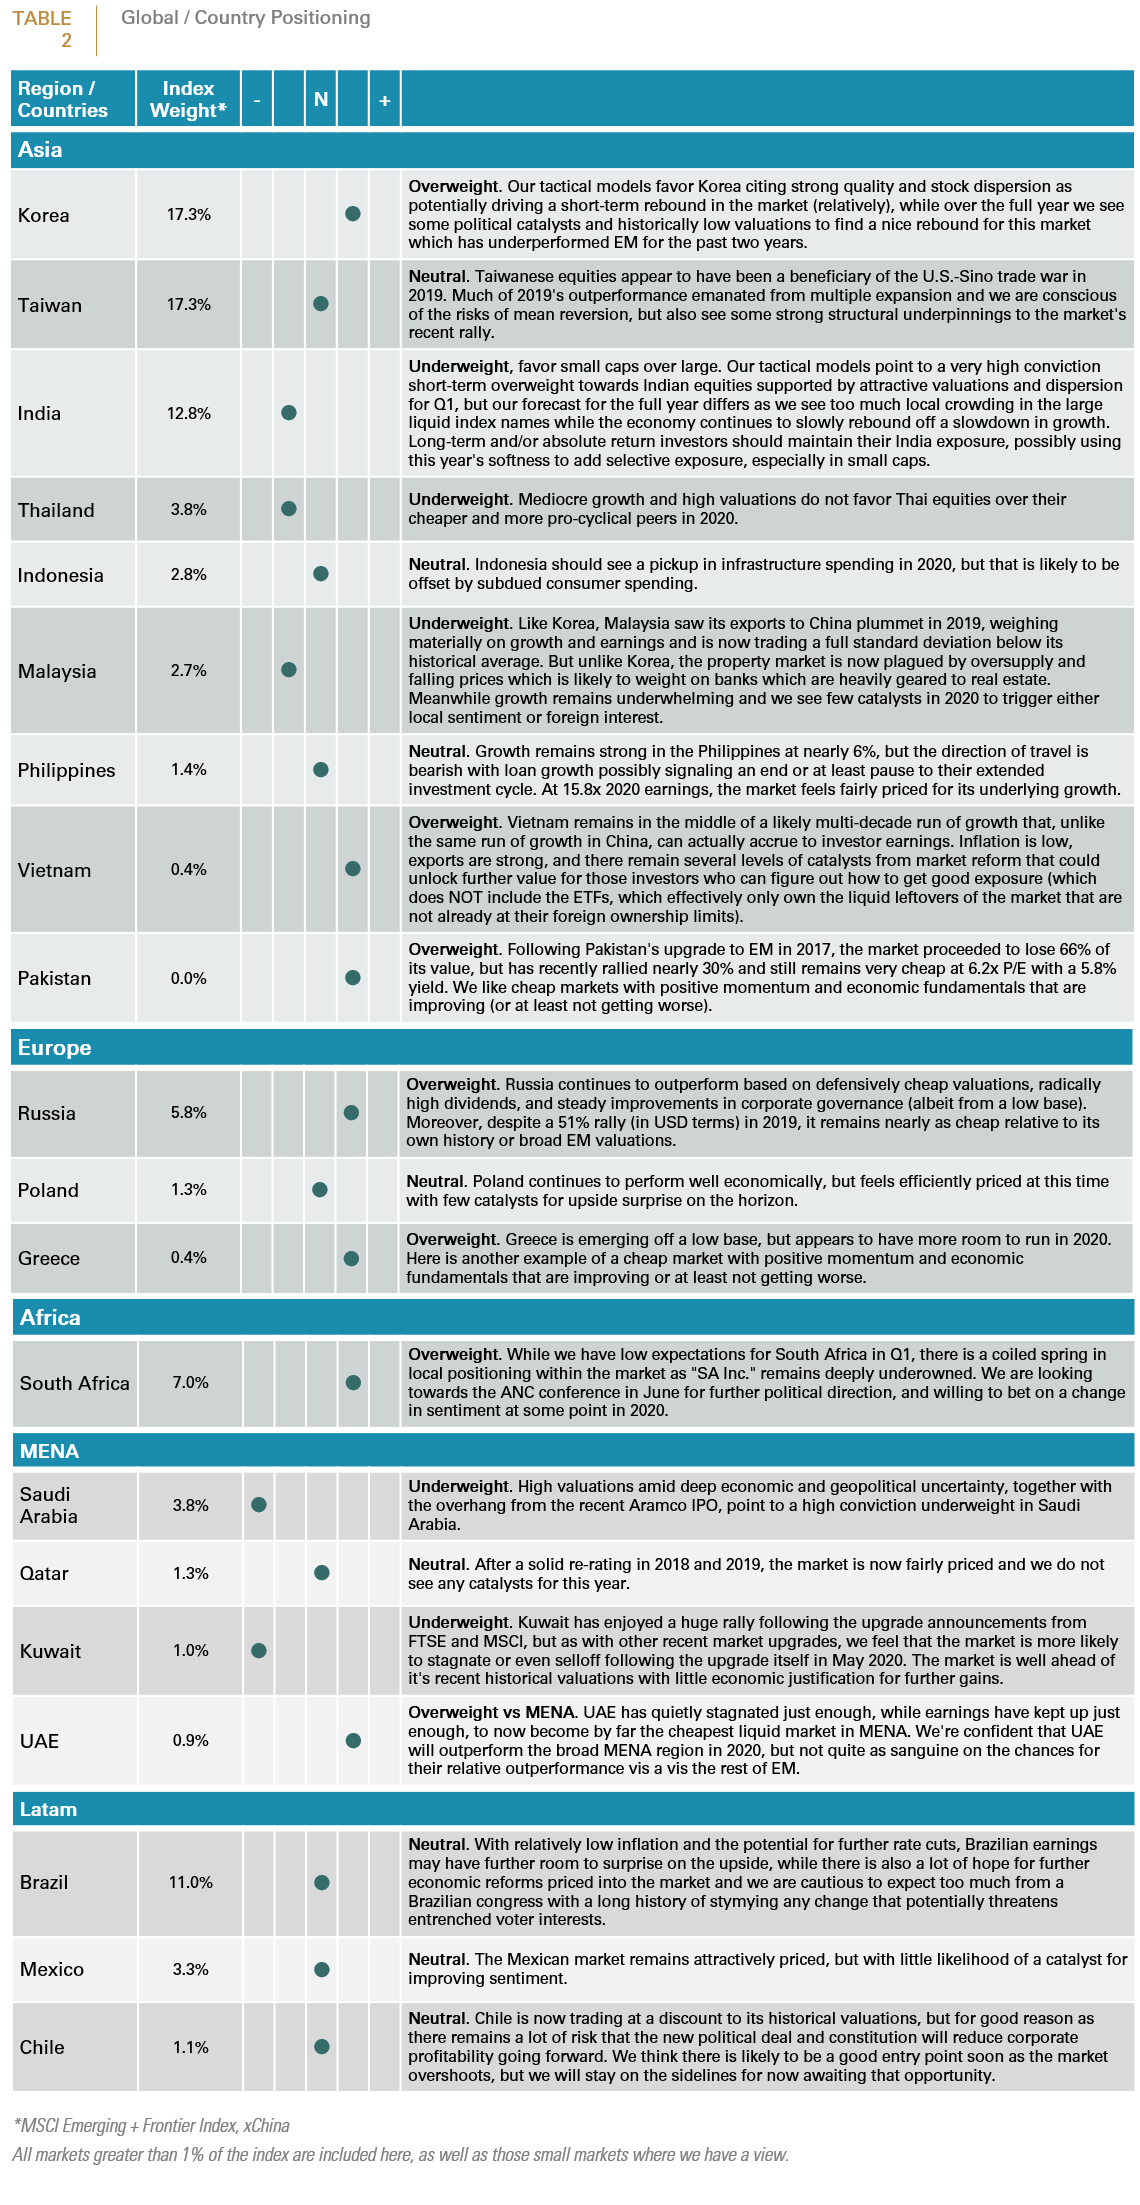
In this inaugural outlook for Emerging + Frontiers x China, we present our detailed views on all the large emerging markets, except China, and our summary calls on all emerging and frontier markets greater than 1% of the EM+FM xChina index, plus those selected small markets where we have an active call (see Table 2 at the end of this paper). As we forecast in our August 2017 research paper, “Whither the GEM Manager”, investors are increasingly making their allocation decisions to China independent of emerging markets, as the scale of the Chinese market continues to increase both in absolute and relative terms. For our part, we have long covered the Chinese market within our regular quarterly Global Outlook (where no such outlook is complete without a rigorous understanding of the Chinese economy) and will continue to do so. In this review, we hope to provide our clients and partners more granular views on the rest of the leading emerging markets, which present a diversified range of opportunities. Also uniquely from our regular quarterly global outlook, we take a slightly longer horizon (12 months) to look at where we believe the medium-term opportunities in these markets may lie. In the short-term, the current slowdown from the coronavirus (profiled in more detail in our forthcoming piece) does present further risks for emerging market equities that suggests some variance from this year-long outlook, but despite the short-term effects of the virus, we remain positioned for a cyclical pickup anticipating that markets will resume their normal course within a few months.
Korea: Overweight
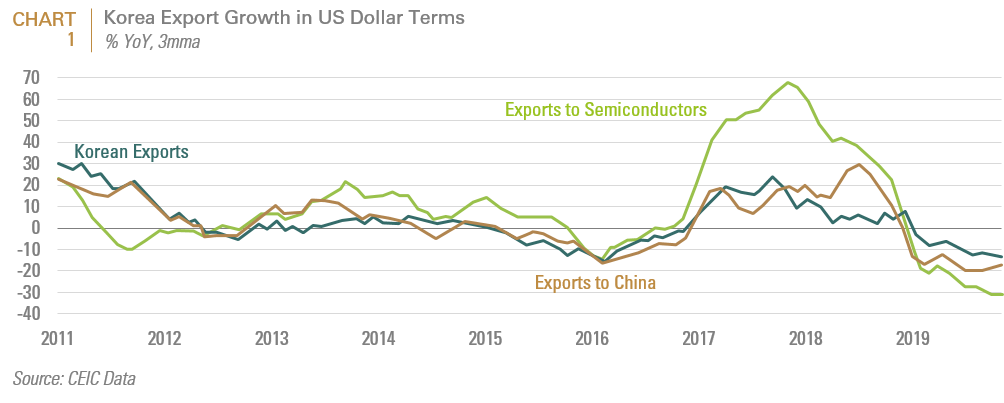
Thus far, Korea appears to be the big loser of the US-Sino trade war, as China accelerated its efforts to rebalance its current account and dramatically reduced its imports from Korea (as well as Japan and some other Asian markets). Korean exports to China took their worst hit in a decade as China cut off the import of semiconductors and other electronics (see Chart 1). Yet the Korean large caps of Samsung Electronics and Hynix rose by +44% and +56% last year compared with a -2.5% decline for the rest of the market. Against the backdrop of an +18% rise in EM, this made Korea (outside the top two stocks) one of the worst performing markets worldwide in 2019.
While Korea’s external accounts deteriorated, the economy stagnated at home. Korean President Moon Jae-In followed through on campaign promises to raise minimum wages and implement a 52-hour work week, which while pulling Korea closer in line with other developed markets, put pressure on corporate earnings. Of great concern now to the Moon Administration is the frothy property market, where a combination of historically loose lending practices, low interest rates and modest (albeit marginally improving) dividend yields have pushed incremental market liquidity into real estate instead of the stock market. President Moon has vowed an “endless” stream of strong measures to reign in housing prices, but attempts to burst the burgeoning bubble have had mixed success to date. Nationwide home prices have remained stable, but some regions like Seoul’s affluent Gangnam district have continued to rise another 20% over the past two years. Finally, a late 2019 scandal in one of the largest Korean hedge funds further depressed sentiment locally. The one area of strong growth in Korean markets, has been to move money offshore, which more than doubled last year.
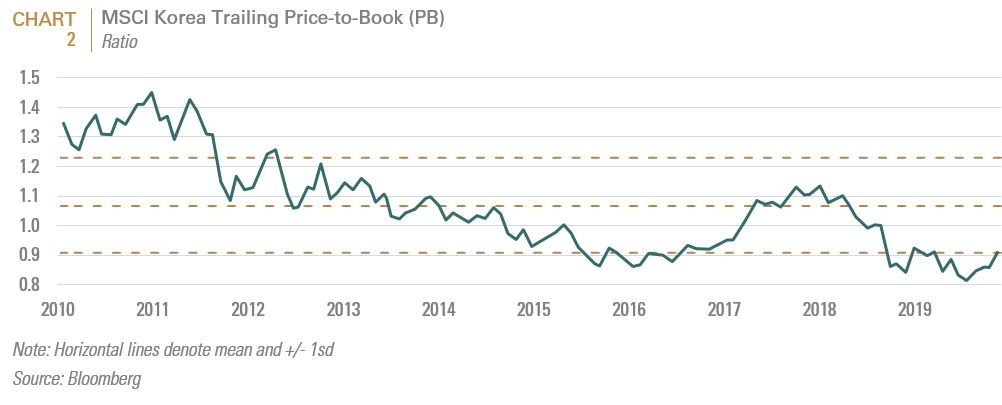
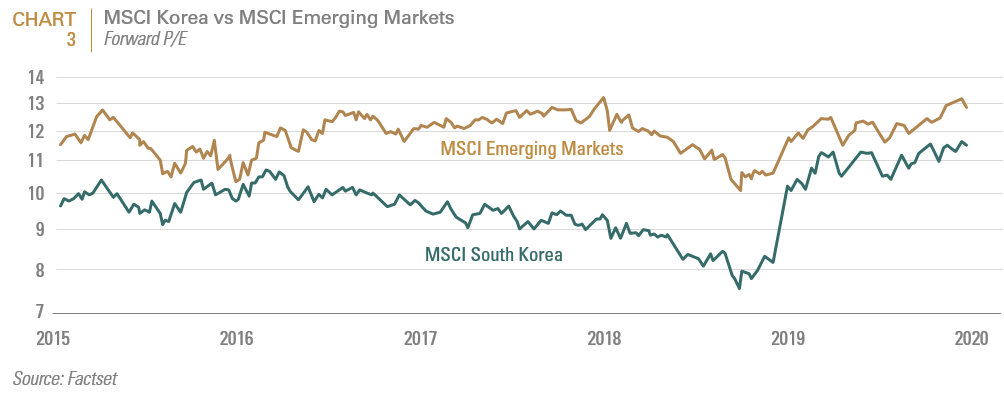
In July, Korean equities hit their lowest book value in a decade, before enjoying a small rally before the end of the year (see Chart 2). Valuations on a P/E basis, given depressed earnings, appear less compelling, but are still comfortably below the EM average (see Chart 3). Despite pressure on earnings, corporate cash flows have remained strong and above peer averages while dividend yields have nearly converged with EM peers. The Moon Administration, facing legislative elections in April 2020, has begun to talk publicly of a fiscal stimulus package geared towards building new housing (supply-side shocks to soaring housing prices) and some rural infrastructure projects. There is also some hope on the external front. Credible reports of a trip to Seoul by Xi Jingping “before summer” offer a legitimate hope of at least a partial reversal of the export trends. To recall, the initial deterioration in Chinese import demand dates back to the 2017 spat over Korea’s deployment of THAAD missiles, and while Korea quickly backed down, exports have never fully recovered, opening up some room for a political catalyst. Finally, our global forecast (see our Global Outlook) is for a likely rebound in global manufacturing and generalized softness in the USD, which should be supportive of foreign investor appetites for pro-cyclical, value markets like Korea (even despite the current slowdown from the coronavirus).
Taiwan: Neutral
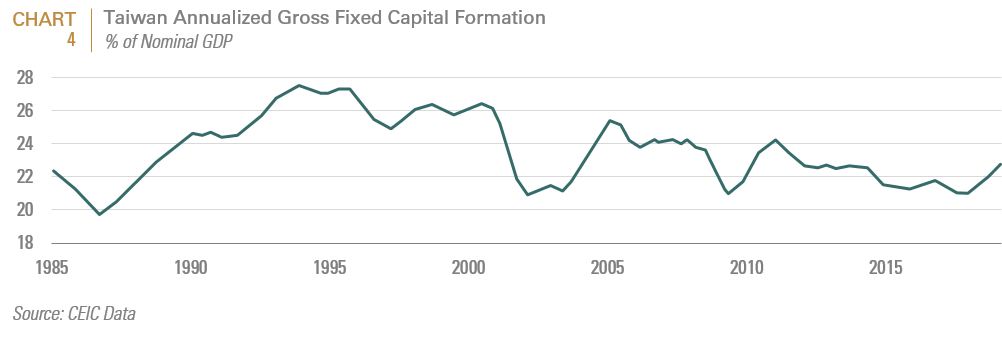
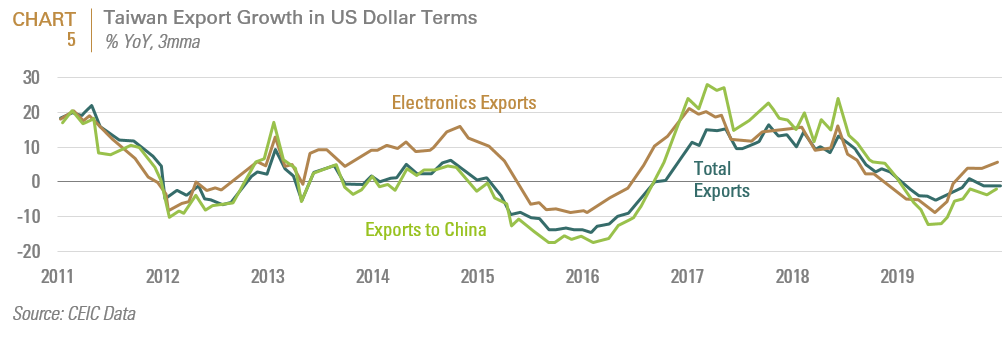
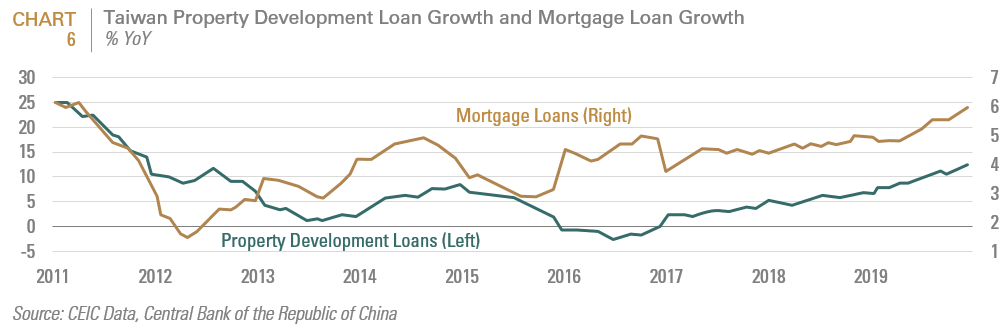
If Korean equities were the loser of U.S.-Sino trade war, Taiwanese equities were seemingly the winner. In 2019, several OEM suppliers moved production back to Taiwan to avoid tariffs, while local tech companies took market share from American suppliers amid China’s rollout of 5G. This led to a mini-capex cycle in Taiwan, a rebound in exports, and a surge in property development (see Charts 4-6). The MSCI Taiwan surged by over 37%, led by index heavyweight Taiwan Semiconductor (TSMC) which gained 58% and accounted for over half of the index’s gain and now represents over 37% of the index weight.
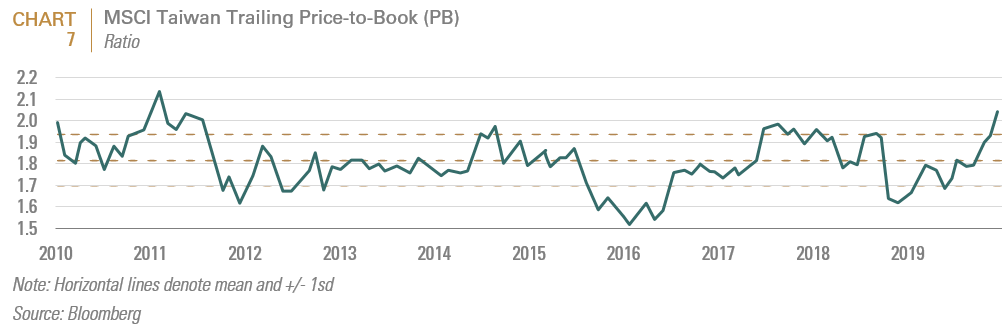
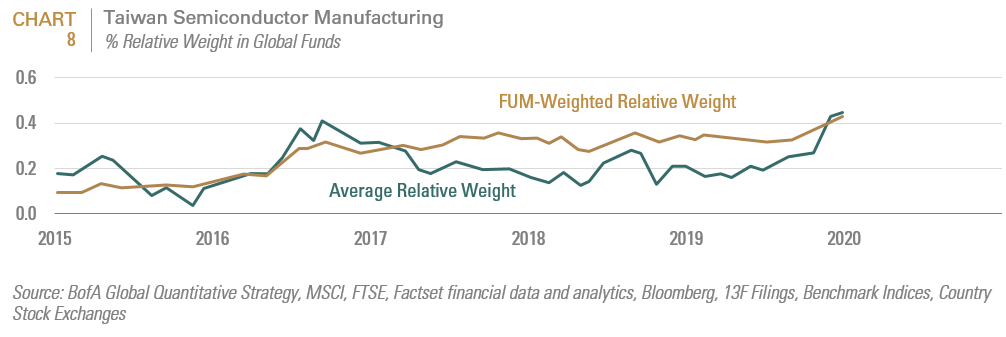
Amid this backdrop, the initial rally in Taiwanese equities appeared well supported by fundamentals. But Q4’s 18% surge in the Taiwanese market, led by TSMC, may have propelled this market to overbought levels. The index is now trading at well over a standard deviation of its 10-year average and at a level not seen since mid-2011 (see Chart 7). TSMC in particular has seen its overweight in global GEM funds rise (see Chart 8) and may be a likely source of cash for these funds in 2020. While we are not especially bearish on Taiwan, which continues to enjoy many attractive structural advantages (good corporate governance, high dividend yield, good liquidity, low cost of capital, etc.), the market appears fully priced and could be a likely source of capital on any further strength in 2020.
India: Underweight, Favor Small Caps
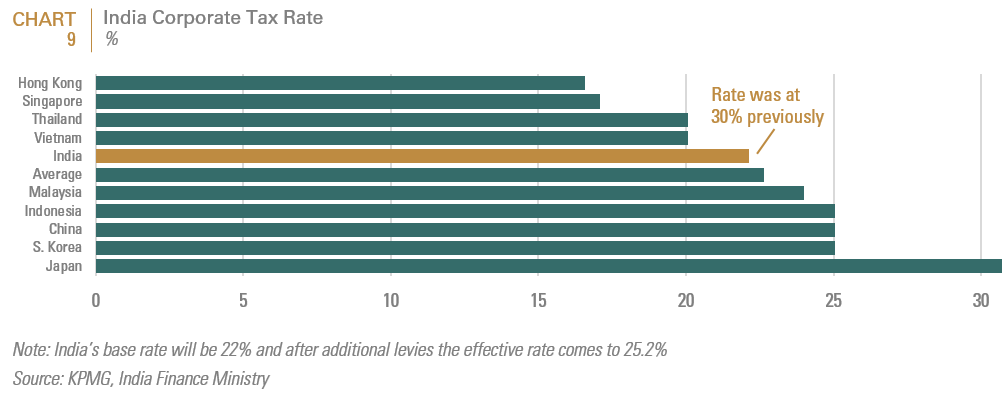
India’s Prime Minister, Narendra Modi, who is widely seen as a market friendly reformer, won a surprisingly large mandate in the May 2019 elections, cementing his party’s power for a further four years. In his first term, Modi passed critical bankruptcy legislation, reformed the previous Byzantine system of state-level taxes to a new national goods and services tax (GST) system, and is succeeding at stamping out corruption throughout much of the national government. Last Fall, India surprised global markets by cutting corporate taxes to rates that put India on nearly equal footing with other Asian (see Chart 9) low cost manufacturing hubs. We are hearing even from those local investors who ardently oppose Modi’s ethno-religious brand of politics that his government’s reforms have made material improvements to the Indian economy that will pay dividends for generations to come. So, what’s not to like?!?
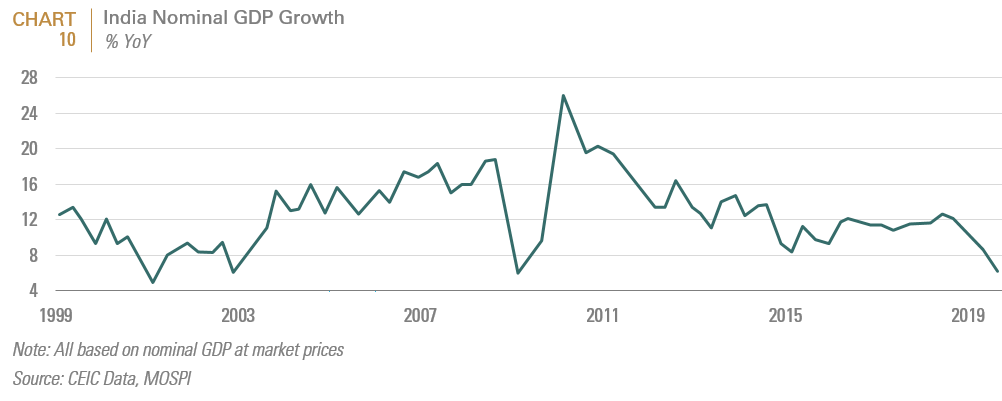
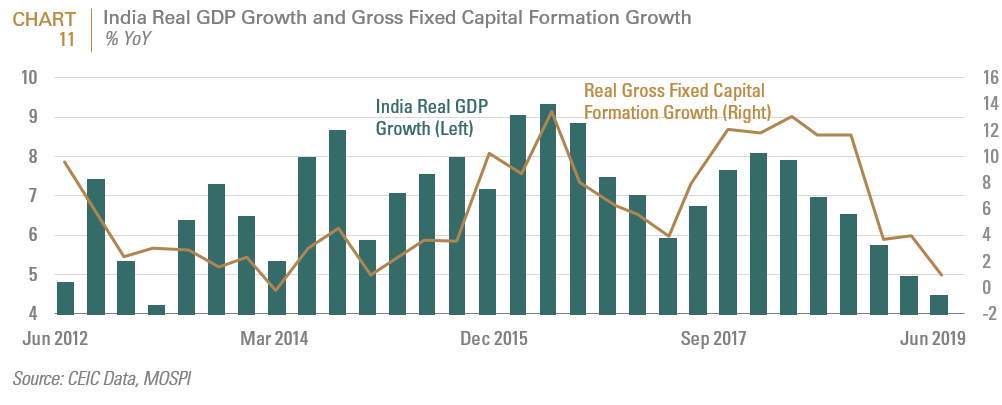
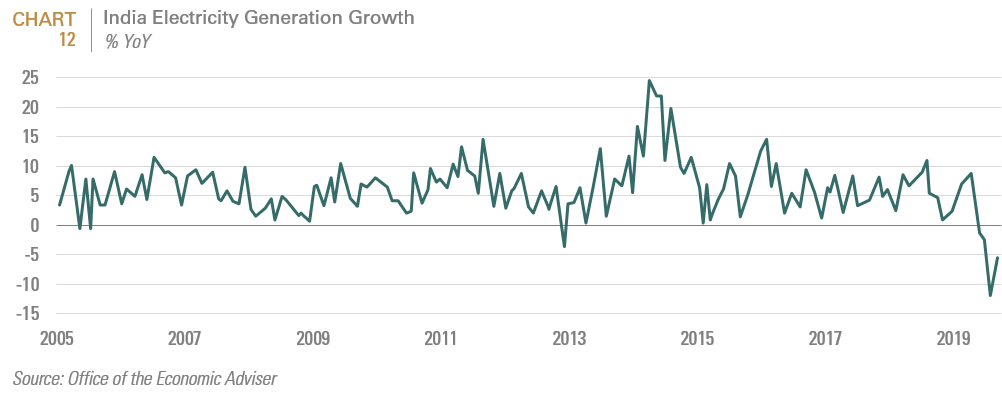
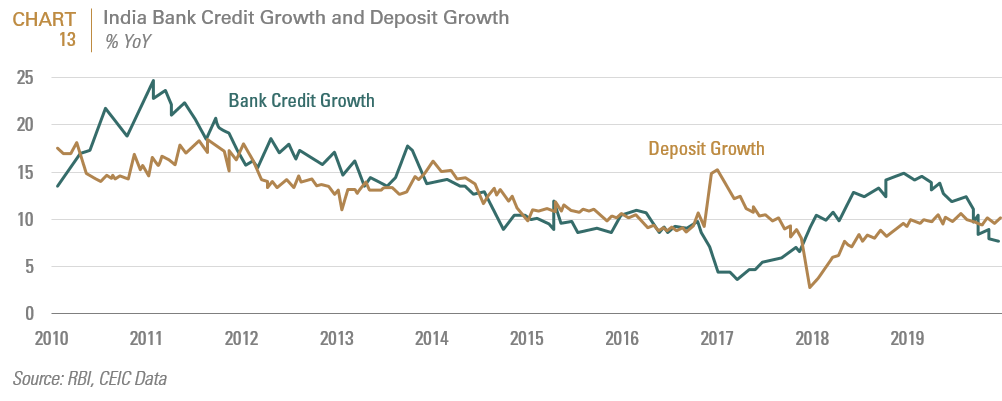
We agree that the long-term outlook in India is positive, but we are also conscious of the short-term dynamics at work in the market. The last official numbers put Indian GDP growth at a paltry 4.5%, its lowest in a decade (see Chart 10). Micro indicators of capex spending, power consumption, credit growth, and others are all depressed (see Charts 11-13). India’s growth slowdown is primarily policy driven, some of which may ultimately inure to stronger long term growth. Modi’s attempt at demonetization (outlawing the largest banknotes in circulation) depressed commerce while yielding no apparent positive impacts. The GST will improve productivity in the long-run, but in the short-term, it has increased compliance costs for businesses. Additionally, the collapse in the non-bank financial sector has squeezed credit lines for businesses and consumers, limiting the growth rate.
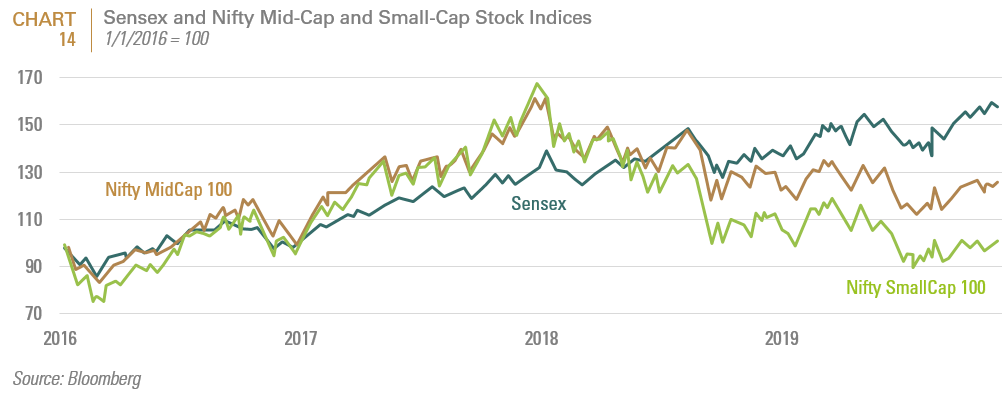
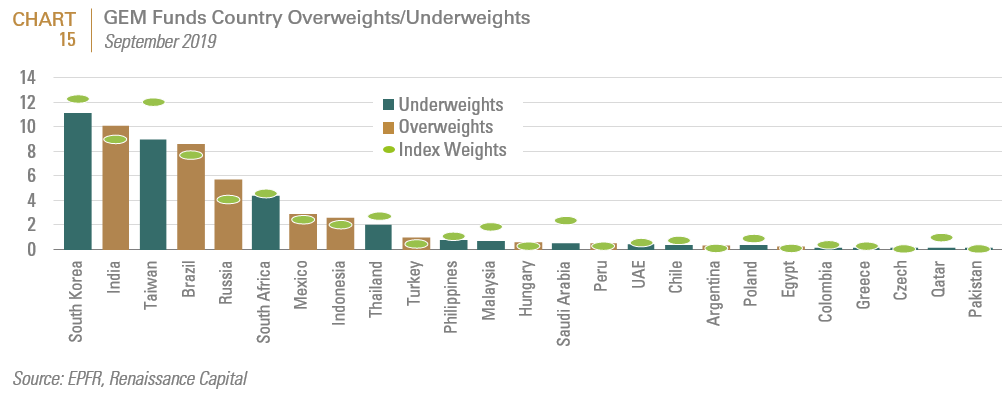
These policies have clearly depressed earnings. Moreover, the confluence of an early 2018 change in local fund regulations and the slowdown in the economy have skewed local investors’ exposure towards defensive large cap stocks, which have diverged sharply in performance from their mid and small cap peers (see Chart 14). Consequently, Indian large caps also represent one of the most crowded trades in EM (see Chart 15). While we strongly prefer Indian small cap exposure through expert active management, we believe that even the broad Indian small cap universe will outperform what we expect to be a relatively modest return from Indian large caps in 2020.
Brazil: Neutral
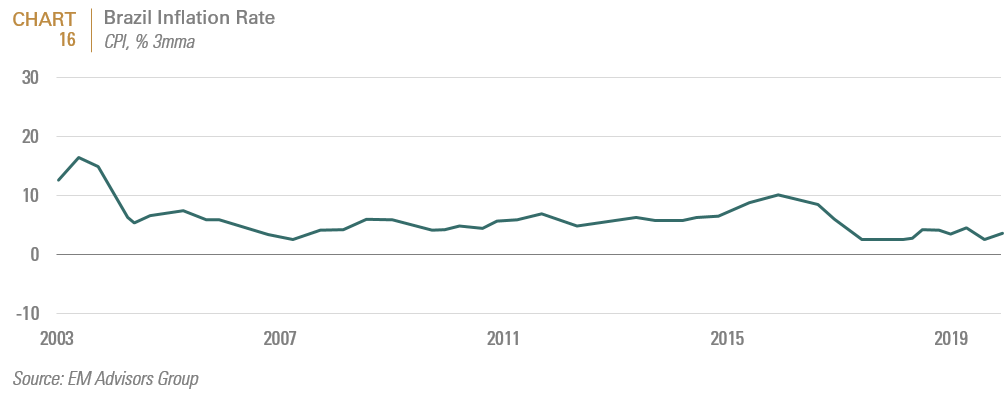
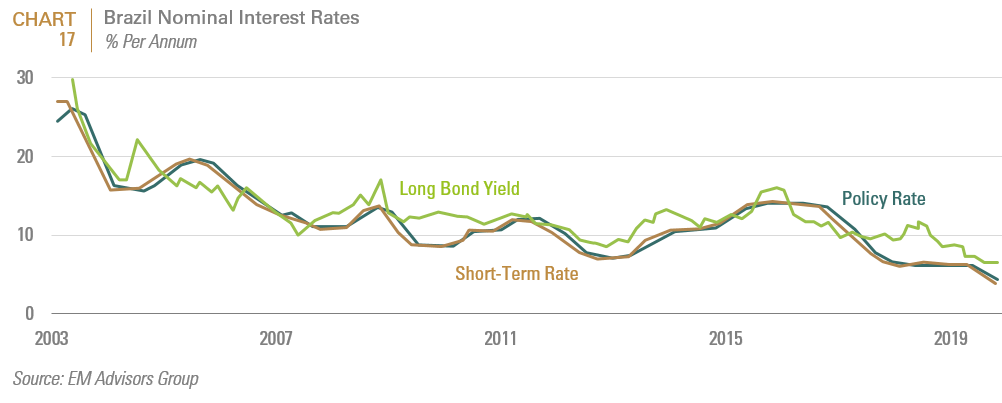
Brazil took a huge step towards meaningful fiscal reform with the passage of pension reform legislation in October 2019. Most projections estimate that this will trim the expected budget deficit by about $195 billion over the next decade. Now the Administration of President Jair Bolsonaro, and his able Economy Minister Paulo Guedes have set their sights on tax reform, though this could prove even more politically challenging. Meanwhile, monetary policy orthodoxy and a benign environment for inflation globally are changing the paradigm of how Brazilians spend and save and how Brazilian companies do business (see Charts 16-17).
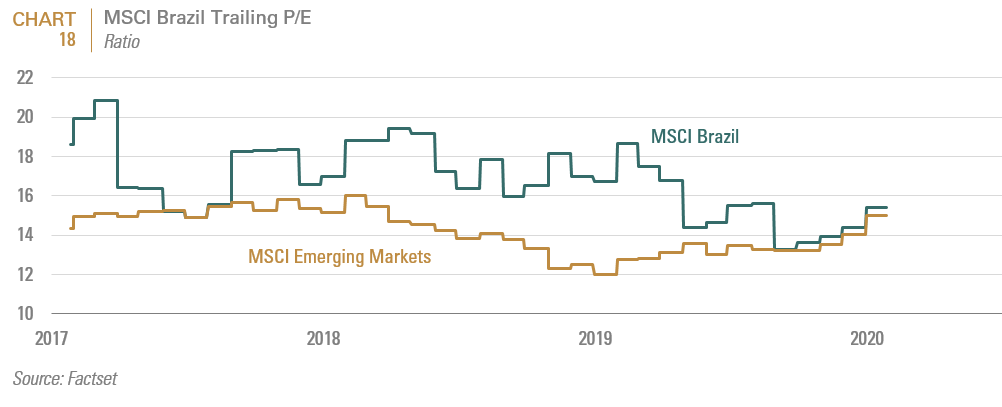
Many foreign investors are seeing these conditions as a new dawn in Brazil, propelling it towards a decade of strong growth. For our part, we remain more skeptical. The reform theme already appears reflected in Brazilian equity prices, which are in line with global EM peers (see Chart 18). Plus, further reform is far from certain given the entrenched political interests, while economic growth remains quite subdued. We remain hopeful for Brazil looking forward, but neutral to the market in 2020, absent clearer catalysts.
South Africa: Overweight
South Africa has underperformed the broad EM index for the last two years. In 2018 this market lost nearly 25% of its value and underperformed the EM index by over 10%. In 2019, the market drifted up +10%, but still underperformed the EM index by over 8%. If one removes the performance of Naspers, which represents over 24% of the index and gained 26% over the last two years (accounting for 61% of that market’s return), the broad South African market gained a mere 5.5% over the past two years. This gap between what locals call “SA Inc.” (the portion of the South African equity market that does most of its business only in South Africa) and the non-Rand stocks (Naspers, Anglo-American, Richemont, or other locally listed stocks that share global cross-listings or are truly global companies with only small minorities of their revenues emanating from South Africa) has hit a near all-time extreme. Adding to the market’s woes, over the past few months the economy has been beset by rolling blackouts (“load shedding”) that are further sapping productivity, confidence, and diverting precious resources.
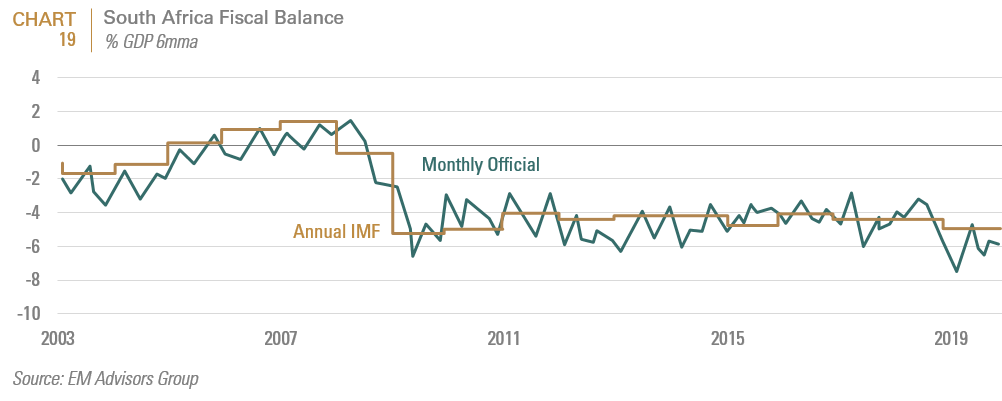
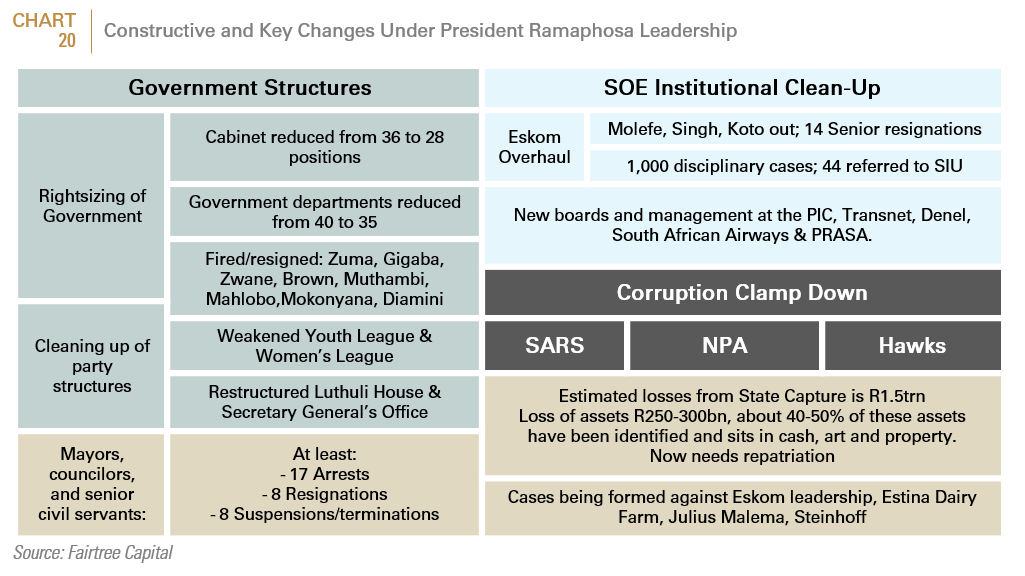
Years of kleptocracy and mismanagement under ex-President Jacob Zuma has sapped investor appetites, drained the economy of its previous dynamism, and saddled the state with unsustainable fiscal imbalances (see Chart 19). South Africa’s current President Cyril Ramaphosa appears firmly aware of the fiscal and economic challenges facing the country and willing to take the difficult steps to confront them. Already he has made an array of reforms to reinforce the nuts and bolts of the government, attempting to restore the revenue services (SARS), the national prosecuting authority (NPA), and South Africa’s investigative and intelligence arm (Hawks) to something resembling their pre-Zuma condition (see Chart 20 for a summary of key reforms to date). However, President Ramaphosa has had to spend the bulk of his political capital merely attempting to fend off residual opposition from the kleptocratic class of his own party (the African National Congress, ANC). As one local asset manager told us recently, President Ramaphosa is a genuine reformer who “is basically driving with the hand brake on.”
The market now appears to be looking towards the ANC party conference in June, which is likely the last opportunity for the Zuma faction of the ANC to remove or effectively strip Ramaphosa of real power and stymie his reform agenda. In the interim, markets will also be watching closely for progress emanating from the Zondo Commission (officially the Judicial Commission of Inquiry into Allegations of State Capture) to see further charges brought against Zuma insiders, thus potentially bolstering Ramaphosa’s hand in the run-up to the ANC party conference.
Were it not for low global interest rates and a rich domestic investor base whose capital is mostly trapped onshore, South Africa likely would have already waded deep into a hard adjustment and currency crisis like those seen recently in Turkey and Argentina. South African sovereigns have already been reduced to junk status by S&P and Fitch and are on watch for a similar downgrade by Moody’s, the specter of which now hangs like the Sword of Damocles over the market.
For our part, all this pessimism feels more like the dark before the dawn. In addition to the potential political catalyst outlined above, the confluence of bottoming global growth following the current slowdown from the coronavirus, new power capacity coming online soon, and an uptick in materials prices (especially precious metals), are tentatively positive signals for South Africa. Perhaps most importantly, all of this pessimism has priced the market at historically low valuations for SA Inc., and in our tracking of local investors’ exposures, we see significant underweights to local equities already pushing against the lower limit mandated by local fund regulations; all signaling a likely bottom to the market. However, South African fundamentals remain fragile, and we would be quick to cash in on the back of a 20-30% rally in risk assets absent material improvements in the local outlook.
Russia: Overweight
Russia led all emerging markets in 2019 with a whopping 51% return, outpacing the broad EM index by over 32%. The biggest single catalyst was Gazprom’s mid-year doubling of its dividend and announcement that it would be increasing its payout ratio further to 50% in the coming years. Gazprom’s move was the culmination of years of pressure by the Kremlin to increase the dividend payouts among all the SOEs. Over the past several years, Russian corporate governance has improved (albeit from a low base), while the government has maintained macro-economic and fiscal orthodoxy. Additionally, the investment environment has also benefited from gradual market reforms to create a stronger local investor base, as well as measures to create a meaningful pension system and improve market transparency.
Politically, however, Russia remains unchanged. Russian President cum Czar Vladimir Putin’s iron grip on power remains not only unchallenged, but was recently cemented further, while the kleptocratic machine that supports him continues unchecked. But political authoritarianism and market orthodoxy can co-exist.
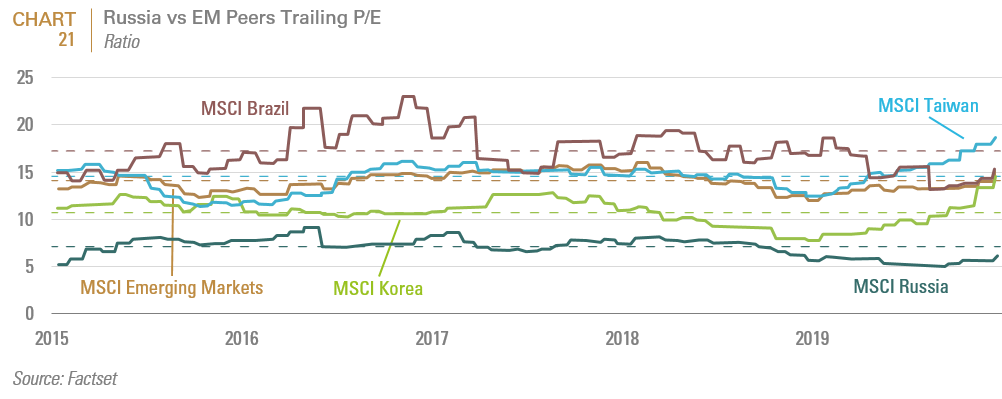
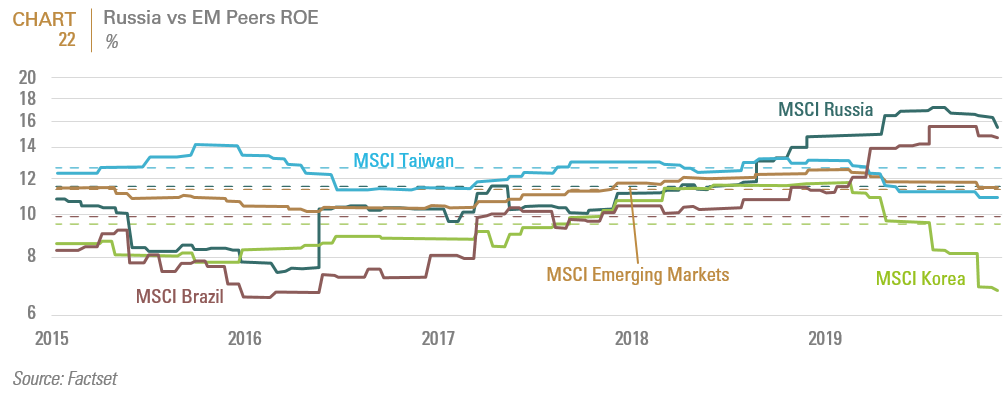
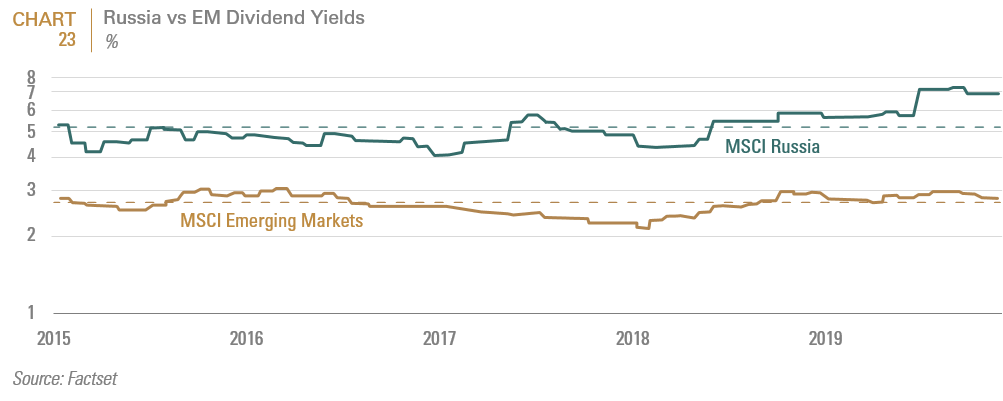
Importantly, even after a hard rally in Russian equities, and two years of massive outperformance versus the rest of EM, the Russian market’s valuation remains little changed on either an absolute or relative basis. Russia’s trailing P/E remains a mere 6.1x, which is both cheaper than its own 5-year average or its 5 year average valuation gap from the rest of emerging markets (see Chart 21). Meanwhile comparably authoritarian China and Saudi Arabia trade at 14x and 17x trailing P/E, respectively. Russian ROEs are now among the highest in EM at nearly 16% (see Chart 22), while investors are clipping a coupon of nearly 7%, which is over 2.5x the global EM average (see Chart 23).
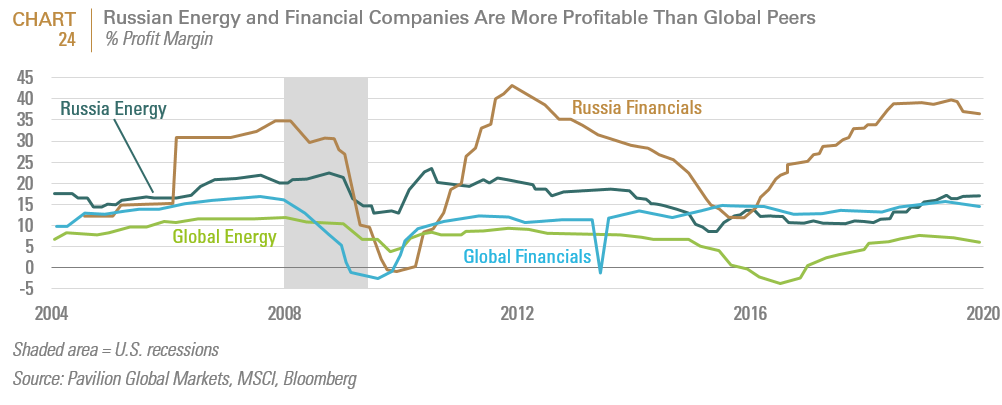
Admittedly, some of these favorable financial metrics reflect the Russian market’s sector composition as much as the full relative opportunity. But Russian financials and energy firms (which comprise over 75% of the Russian index) are also substantially more profitable than their global peers (see Chart 24).
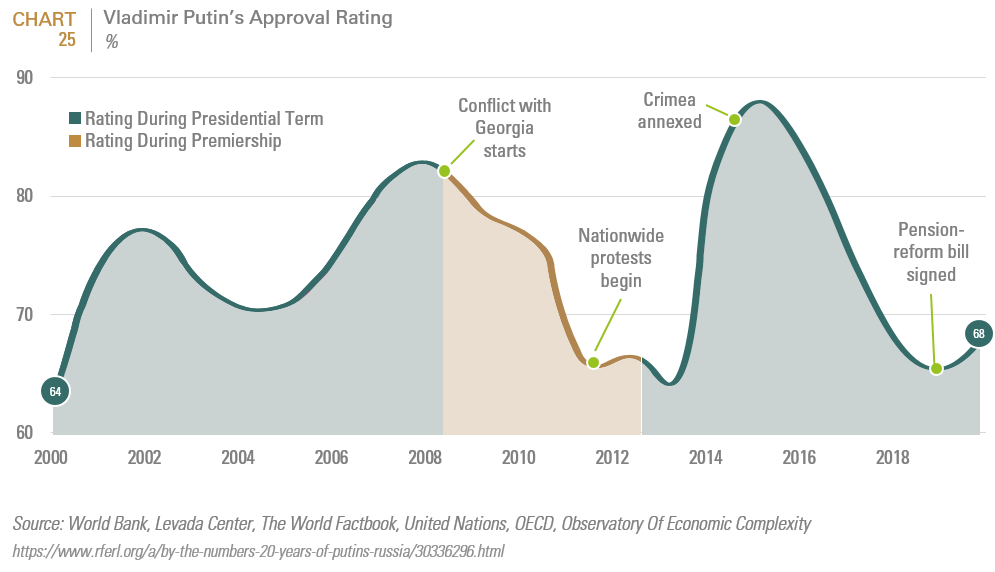
FIS has been overweight Russia for over two years, happily capturing the vast majority of this huge rally in Russian equities. We maintained and added to our position even in the face of added sanctions back in 2018 and again in early 2019 amid uncertainty over global risk appetites. What did concern us, was Putin’s approval rating, which hit a near all-time low in late 2018 (see Chart 25). Historically, Putin has responded to ebbing approval ratings by starting conflicts with its neighbors (Georgia and Ukraine) and there were some early signals of a new conflagration in the Black Sea in late 2018. But this power expansion appears now to be aimed mostly at taking further territory from Ukraine, or at least stripping the Ukrainian port of Mariupol of its utility to further weaken the Ukrainian government and strengthen Russia’s hand over its occupation of eastern Ukraine. This geopolitical risk appears already well discounted by the markets.
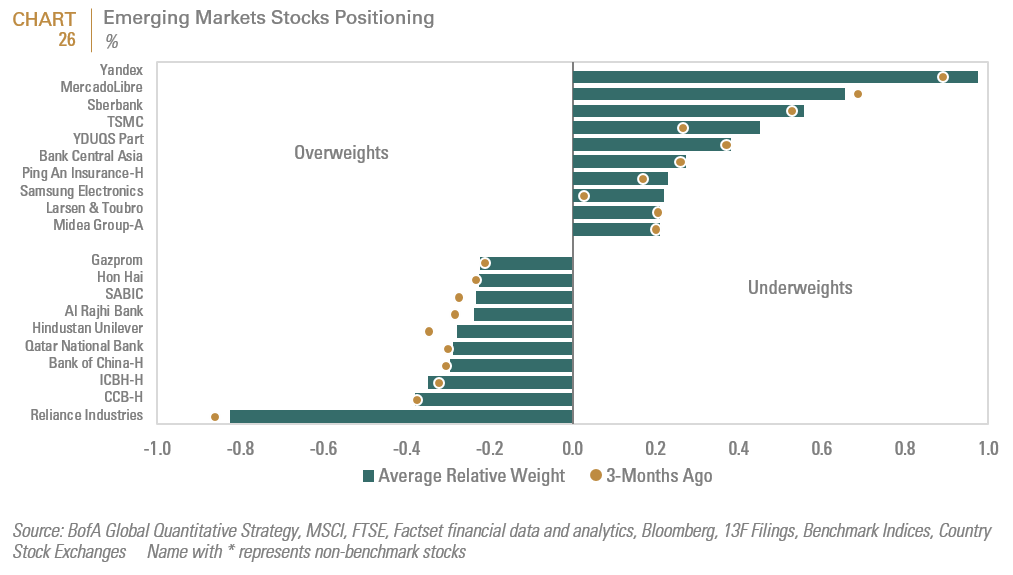
Russia is now the largest country overweight among global emerging market funds (see Chart 15), leading Russia’s largest bank, Sberbank, to become the largest weight in the Russian index and a global favorite of GEM funds (see Chart 26). The largest overweight EM stock worldwide is Russian search engine Yandex, which is not in the MSCI index at all, while Gazprom, the second largest stock in the Russian index, remains one of the most underweight stocks worldwide. This leaves some room for further rotation into the Russian index without a concomitant increase in country weights by GEM managers, but we are conscious of Russia becoming a crowded trade.
Saudi Arabia: Underweight
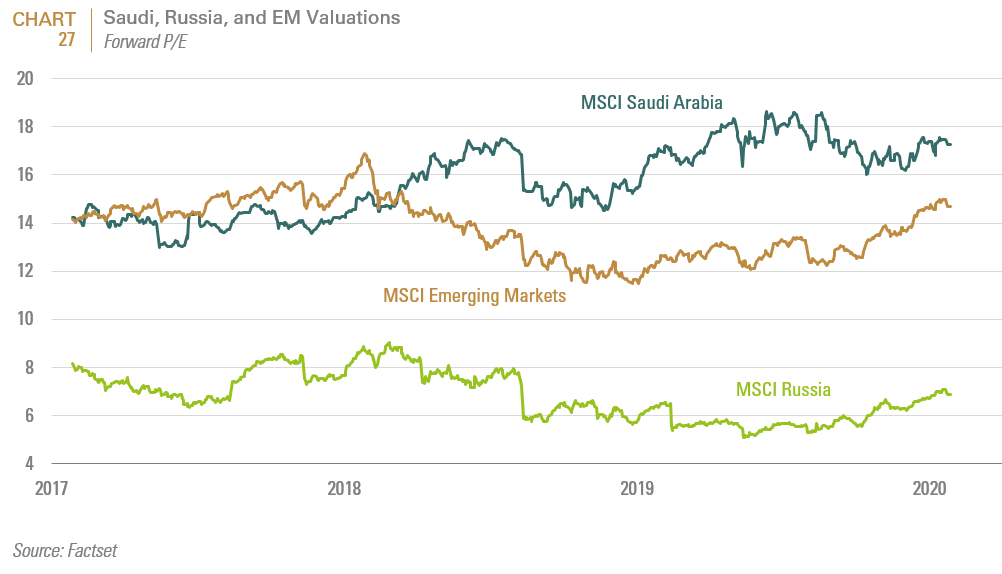
Few markets across EM appear as singularly unattractive to us as Saudi Arabia. The market is expensive (see Chart 27), in the midst of significant economic change that portends equal parts winners and losers within the equity market (which is good for active stock-picking or long/short strategies, bad for beta), dependent on a captive local investor base, and prone to government interference. In our view, Saudi Arabia is substantially comparable to Russia, sharing very similar political governance, corporate governance (both are ok, with Russia getting better), both economically dependent on hydrocarbons, and both with fairly strong fiscal and macro-economic balances. And yet, Russian equities are available at a fraction of the cost of their Saudi counterparts. We believe that the much larger local Saudi investor base is the reason for this imbalance, but we also see that local investor base as broadly static, with more possibilities for their diversification of assets outside Saudi while Russia continues to slowly develop their own pension system. In a bear market, we might expect Saudi to hold up materially better than Russia or the rest of EM, given the strong local investor base, government backstop on the market, and solid currency peg to the USD. However, in any other market environment, we find nothing but a handful of interesting single stock ideas in the Saudi equity market.
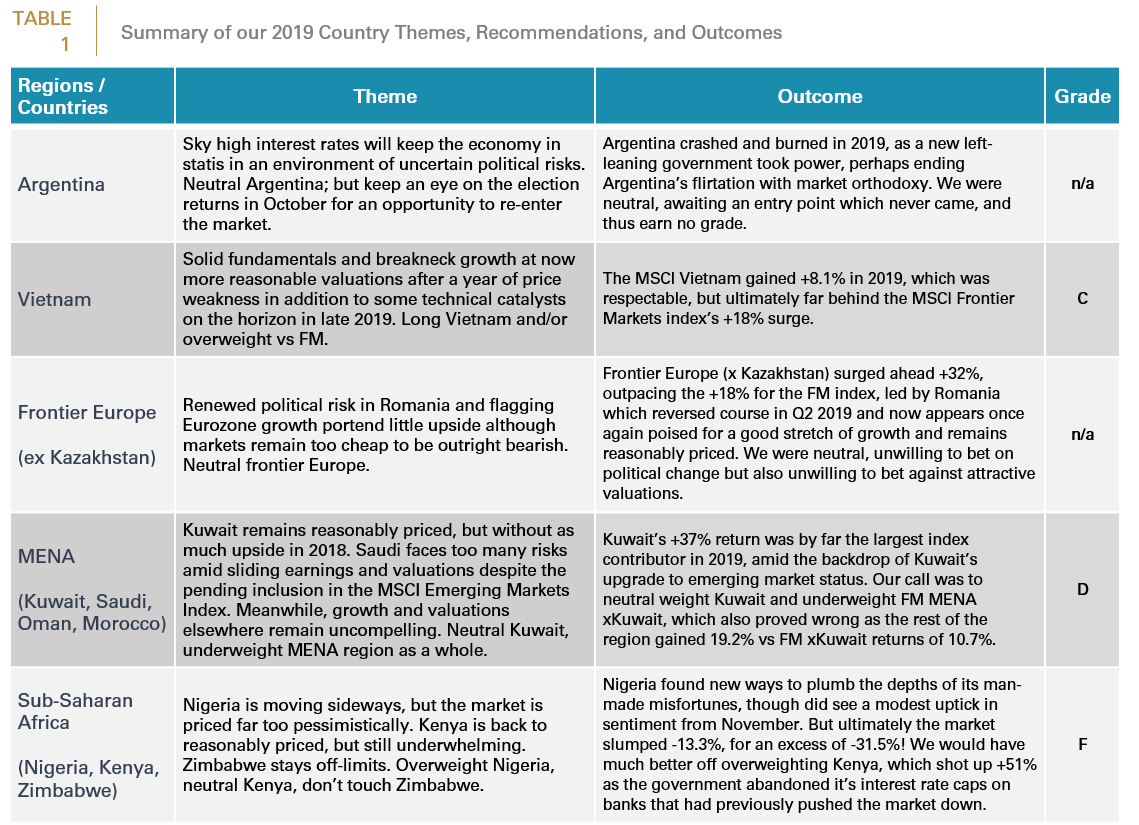
2019 Frontier Markets Report Card
After three consecutive years of tallying a solid A- average for our calls in frontier markets, in 2019 we were sent to the back of the classroom, and were last seen wearing the dunce cap. Our best call was to sit on the sidelines in Argentina, waiting out the uncertainty that ultimately proved even worse than we imagined. Our long-term bullishness on Vietnam also worked well (+8%), but simply could not compete with the euphoria that ran ahead in Kuwait as that market was rewarded with an upgrade to EM status by both FTSE and MSCI and surged +32% (contributing 56% of the FM index’s returns). The big positive market surprises in FM came on the back of deeply non-consensus political changes (Romania and Kenya) or multiple expansion (Kuwait), where we simply sat on the sidelines in each case. Our worst active call, Nigeria, saw no deterioration in market fundamentals, but also no improvements, and seems to have sold down largely on the back of global redemptions from the asset class.
Following the May 2020 upgrade of Kuwait to EM, the MSCI Frontier Markets Index will be left with just over 80 names (maybe 85 if you include the handful of new entrants from Iceland). While we remain selectively bullish on certain frontier markets (esp. Vietnam), and feel strongly that stock pickers in this neglected asset class have great reason for optimism, we no longer feel the Frontier Markets Index has any serious value as an allocation guide for investors. Our country-level research is thus shifting to a broader focus on EM xChina for the foreseeable future. We recommend that institutional emerging market investors without dedicated frontier exposure take steps to allow their active managers the flexibility to dip into the frontier markets within their emerging markets allocations in order to capitalize on the idiosyncratic opportunities worldwide, but increasingly see the index-constructed designations of emerging vs frontier markets as a curious bureaucratic anachronism.
Important Disclosures:
This report is neither an offer to sell nor a solicitation to invest in any product offered by FIS Group, Inc. and should not be considered as investment advice. This report was prepared for clients and prospective clients of FIS Group and is intended to be used solely by such clients and prospects for educational and illustrative purposes. The information contained herein is proprietary to FIS Group and may not be duplicated or used for any purpose other than the educational purpose for which it has been provided. Any unauthorized use, duplication or disclosure of this report is strictly prohibited.
This report is based on information believed to be correct, but is subject to revision. Although the information provided herein has been obtained from sources which FIS Group believes to be reliable, FIS Group does not guarantee its accuracy, and such information may be incomplete or condensed. Additional information is available from FIS Group upon request.
All performance and other projections are historical and do not guarantee future performance. No assurance can be given that any particular investment objective or strategy will be achieved at a given time and actual investment results may vary over any given time.